
1. Main points
Borrowing (public sector net borrowing excluding public sector banks, PSNB ex) in January 2020 was in surplus by £9.8 billion, £2.1 billion less of a surplus than in January 2019.
Self-assessed Income Tax and Capital Gains Tax receipts (combined) were £22.7 billion in January 2020, which is £1.3 billion more than in January 2019; late payments mean that the proportion of self-assessed taxes recorded in January and February can vary year-on-year and it is therefore advisable to consider these two months together.
Borrowing in the current financial year-to-date (April 2019 to January 2020) was £44.8 billion, £5.8 billion more than in the same period the previous year.
Debt (public sector net debt excluding public sector banks, PSND ex) at the end of January 2020 was £1,798.7 billion (or 79.6% of gross domestic product, GDP); this is an increase of £41.4 billion (or a decrease of 0.7 percentage points) on January 2019.
Debt at the end of January 2020 excluding the Bank of England (BoE) (mainly quantitative easing) was £1,624.9 billion (or 72.0% of GDP); this is an increase of £54.4 billion (or an increase of 0.2 percentage points) on January 2019.
Central government net cash requirement excluding both UK Asset Resolution Ltd and Network Rail was £37.7 billion in the current financial year-to-date; this is £21.2 billion more than in the same period last year.
2. Borrowing
In January 2020, the public sector spent less money than it received in taxes and other income, to the extent that it had a surplus of £9.8 billion. This surplus was £2.1 billion less than in January 2019. We regularly see a surplus each January, because of the receipt of self-assessed Income Tax.
The difference between central government’s income and spending makes the largest contribution to the amount borrowed by the public sector.
In January 2020, while central government was in surplus by £11.9 billion, local government and public corporations borrowed £2.4 billion and £0.2 billion respectively.
Additionally, the Bank of England’s (BoE’s) contribution to net borrowing was a surplus of £0.7 billion.
The data for the latest months of every release contain a degree of forecasts. This is because profiles of tax receipts, along with departmental and local government spending, are still provisional. This means that the data for these months are typically more prone to revision than other months and can be subject to sizeable revisions in later months.
Figure 1 presents both monthly and cumulative public sector net borrowing excluding public sector banks (PSNB ex) in the current financial year-to-date (April 2019 to January 2020) and compares these with the same period in the previous financial year.
Figure 1: The Office for Budget Responsibility expects borrowing to increase to £47.6 billion in the financial year ending March 2020
Public sector net borrowing excluding public sector banks, UK, cumulative financial year-to-date (April 2019 to January 2020) compared with the financial year ending March 2019 (April 2018 to March 2019)
Source: Office for National Statistics – Public sector finances
Notes:
- The Office for Budget Responsibility (OBR) full financial year forecast of PSNB ex for the FYE March 2020, taken from the Restated March 2019 Forecast, published in December 2019.
Download this chart Figure 1: The Office for Budget Responsibility expects borrowing to increase to £47.6 billion in the financial year ending March 2020
Image .csv .xlsFigure 2 summarises how each of the five sub-sectors (central government, local government, non-financial public corporations, public sector pensions and the BoE) contribute to the overall growth in monthly PSNB ex in January 2020 and compares this with the equivalent measures in the same month a year earlier (January 2019).
Figure 2: Public sector net borrowing excluding public sector banks by sub-sector, UK, January 2020, compared with January 2019

Source: Office for National Statistics – Public Sector Finances
Notes:
- PSNB ex - Public sector net borrowing excluding public sector banks.
- CGNB - Central government net borrowing.
- LGNB - Local government net borrowing.
- PCNB - Non-financial public corporations' net borrowing.
- BoENB - Bank of England net borrowing.
- L&P - Land and property.
- I&W - Income and wealth.
- NICs - National Insurance contributions.
- Contributions to EU - UK VAT, GNI and abatement contributions to the EU budget.
- o/w - Of which.
Download this image Figure 2: Public sector net borrowing excluding public sector banks by sub-sector, UK, January 2020, compared with January 2019
.png (151.4 kB) .xls (96.3 kB)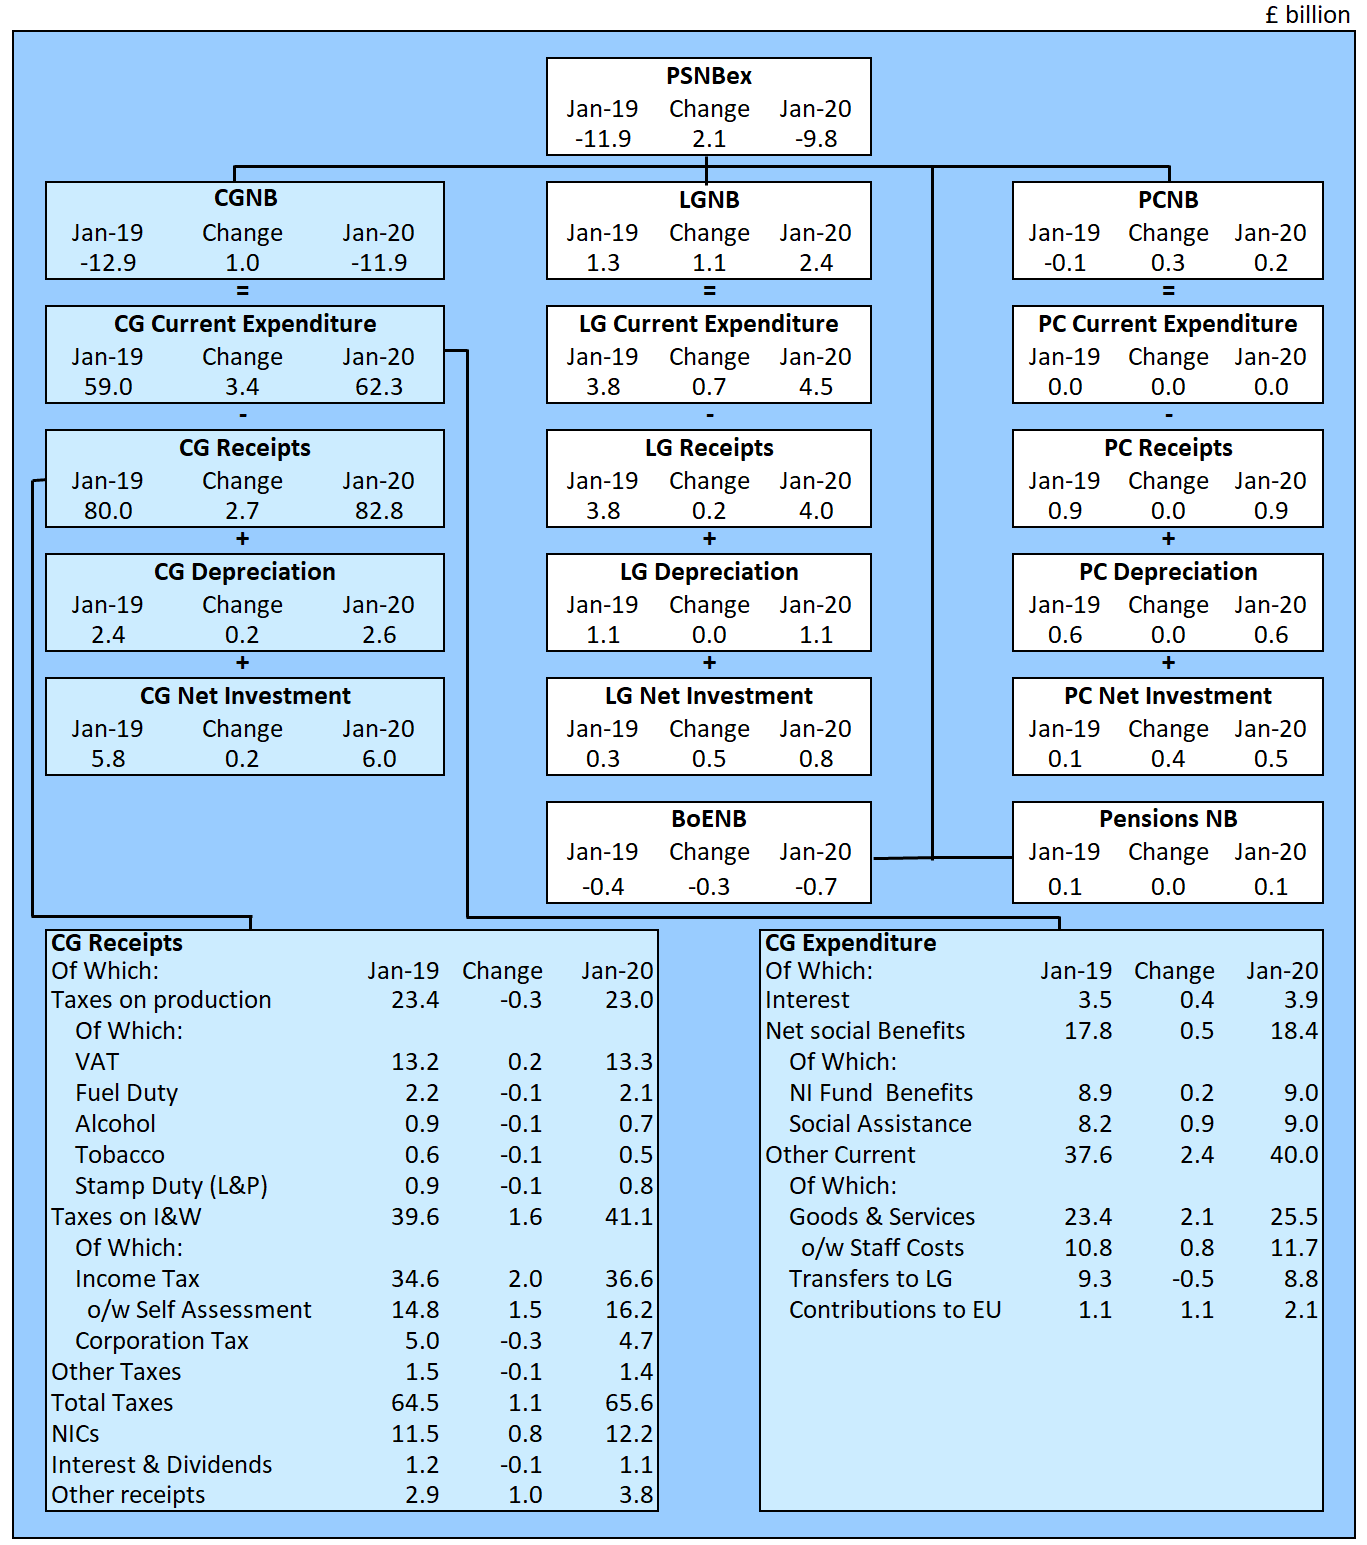
Central government receipts
In January 2020, central government receipts grew by 3.4% compared with January 2019 to £82.8 billion, including £65.6 billion in tax revenue.
It is important to note that as with many other taxes, the accrued measures of both Corporation Tax and Value Added Tax (VAT) contain some forecast cash receipts data and are liable to revision when actual cash receipts data are received.
Self-assessed Income Tax
In both January and (to a lesser extent) July, central government receipts are particularly high because of the receipt of self-assessed Income Tax and Capital Gains Tax cash payments:
self-assessed Income Tax receipts in January 2020 were £16.2 billion, an increase of £1.5 billion compared with January 2019; this is the highest January on record (records began in January 2000)
Capital Gains Tax receipts in January 2020 were £6.5 billion, a decrease of £0.2 billion compared with January 2019
combined self-assessed Income Tax and Capital Gains Tax receipts in January 2020 were £22.7 billion, an increase of £1.3 billion compared with January 2019; this is the highest January on record (records began in January 2000)
Any increases in tax receipts reduce central government (and so public sector) net borrowing by a corresponding amount.
The revenue raised through self-assessed taxes, although affecting primarily January and July receipts, also tends to lead to high receipts in the following month (February and August respectively), although to a lesser degree.
The proportion of self-assessed taxes recorded in January and February can vary year-on-year and it is therefore advisable to consider data for the two months (January and February) together.
In January and February 2019, the government raised £27.5 billion in combined self-assessed Income Tax and Capital Gains Tax receipts (£21.4 billion in January and £6.1 billion in February).
Airbus deferred prosecution agreement
On 31 January 2020, the Serious Fraud Office announced a €991million (equivalent to £843 million) Deferred Prosecution Agreement (DPA) with Airbus. Under the terms of the DPA, Airbus agreed to pay a fine and costs amounting to €991million in the UK, as part of a €3.6 billion global resolution involving authorities in France and the United States.
Of this £843 million, £338 million is due to be paid within 30 days of the ruling, with the balance to be settled on 31 January 2023.
In line with statistical guidance, the payment of a fine is reported when the fine was issued. Therefore, central government “other” receipts in January 2020 include the full £843 million, reducing central government (and so public sector) net borrowing by a corresponding amount. Central government net cash requirement will be reduced when the cash payments are received by central government.
Bank of England Asset Purchase Facility Fund
In January 2020, there was a £0.2 billion dividend transfer from the Bank of England Asset Purchase Facility Fund (BEAPFF) to HM Treasury.
As with other such transfers, central government net borrowing is reduced by the value of transfer receipt, while the net borrowing of the Bank of England is increased by an equal and offsetting amount. There is no impact at the public sector level.
Central government expenditure
In January 2020, central government spent £68.3 billion, an increase of 3.6% on January 2019. Of this amount, around two-thirds was spent by central government on providing services and grants (for example, related to education, defence, and health and social care); just below one-third was spent on social benefits (such as pensions, unemployment payments, Child Benefit and Statutory Maternity Pay); and the remainder was spent on capital investment and interest on the government’s outstanding debt.
Departmental expenditure on goods and services
Departmental expenditure on goods and services in January 2020 increased by £2.1 billion compared with January 2019, including a £0.8 billion increase in expenditure on staff costs and a £1.2 billion increase in the purchase of goods and services. This increase in pay and procurement partially reflects that we have entered the first of the five years covered by the Department of Health and Social Care (DHSC) spending settlement.
UK contributions to the European Union
The UK contributions to the European Union (EU) in January 2020 were £2.1 billion, an increase of £1.1 billion on January 2019. This increase is largely because of the profile of 2020 payments made to the EU by all member states rather than a reflection of any budgetary increase.
EU regulation sets out a “draw-forward” mechanism, which allows the European Commission to call up to five months’ worth of contributions from member states within the first quarter of the calendar year. This process enables the EU to manage its cash flow, as a larger proportion of the expenditure is paid out during the first quarter of the budgetary year.
In January 2020, the EU requested one-sixth (or two months) of the full annual contribution from each of its member states. This was different from the contribution requested in January 2019. Monthly transactions are often affected by the timings of payments and so caution should be taken when drawing conclusions from monthly data.
The request for more funding from member states under the draw-forward mechanism does not increase contributions over the year, it reprofiles contributions over the budgetary year.
During the transition period of UK withdrawal from the EU, all UK statistics that align with EU practice and rules will continue to do so as before 31 January 2020.
Interest payments on the government’s outstanding debt
Interest payments on the government’s outstanding debt in January 2020 were £3.9 billion, an increase of £0.4 billion, compared with January 2019. Changes in debt interest are largely a result of movements in the Retail Prices Index (RPI) to which index-linked bonds are pegged. The relationship between the RPI and the valuation index-linked bonds is explored further in the Public sector finances Quality and Methodology Information (QMI).
Borrowing in earlier periods
Given the volatility of the monthly data, the cumulative financial year-to-date borrowing figures often provide a better indication of the position of the public sector finances than the individual months’ figures.
In the current financial year-to-date (April 2019 to January 2020), public sector spending has exceeded the money received in taxes and other income. This meant across these 10 months, the public sector borrowed a total of £44.8 billion, £5.8 billion (or 14.9%) more than in the same period last year.
Of the £44.8 billion, £7.2 billion related to the cost of the “day-to-day” activities of the public sector (the current budget deficit), while £37.6 billion was capital spending (or net investment), such as on infrastructure.
The difference between central government’s income and spending makes the largest contribution to the amount borrowed by the public sector.
In the current financial year-to-date, central government receipts grew by 2.6% on the same period the previous year to £631.4 billion, including £468.9 billion in tax revenue.
Over the same period, central government spent £645.5 billion, an increase of 2.9%. Again, around two-thirds of this amount was spent by central government departments on providing services and grants; just below one-third was spent on social benefits; and the remainder was spent on capital investment and interest on the government’s outstanding debt.
Figure 3 summarises the contributions of each sub-sector to borrowing in the current financial year-to-date (April 2019 to January 2020) and compares these with the same period the previous year.
Figure 3: How each sector contributes to the growth in borrowing
Current financial year-to-date (April 2019 to January 2020) compared with the same period last year, UK

Source: Office for National Statistics – Public Sector Finances
Notes:
- PSNB ex - Public sector net borrowing excluding public sector banks.
- CGNB - Central government net borrowing.
- LGNB - Local government net borrowing.
- PCNB - Non-financial public corporations' net borrowing.
- BoENB - Bank of England net borrowing.
- L&P - Land and property.
- I&W - Income and wealth.
- NICs - National Insurance contributions.
- Contributions to EU - UK VAT, GNI and abatement contributions to the EU budget.
- o/w - Of which.
Download this image Figure 3: How each sector contributes to the growth in borrowing
.png (171.4 kB) .xls (86.5 kB)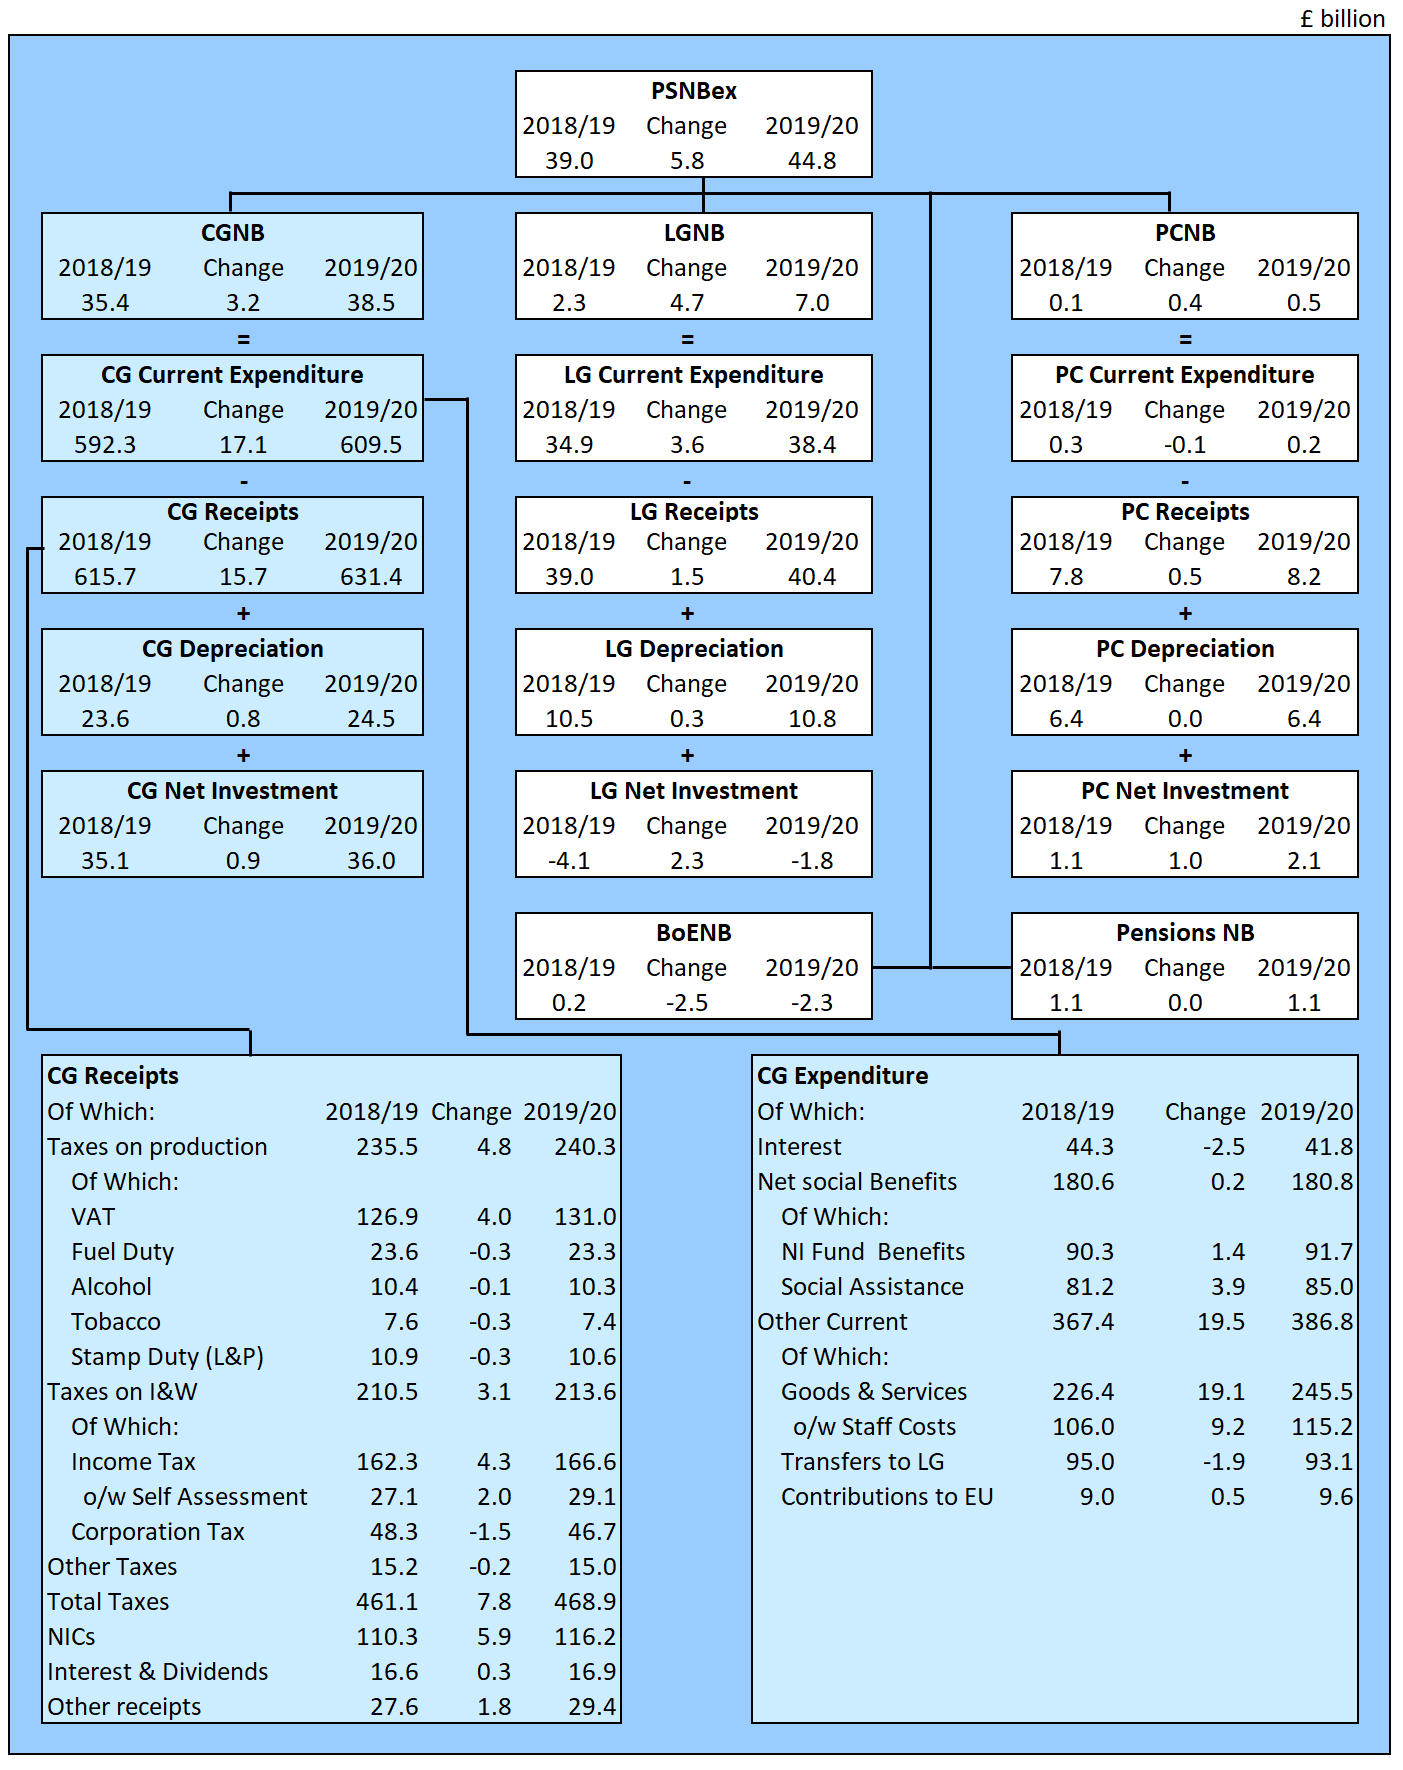
In the latest full financial year (April 2018 to March 2019), the £38.4 billion (or 1.8% of gross domestic product, GDP) borrowed by the public sector was around a quarter (24.3%) of the amount seen in the financial year ending (FYE) March 2010, when borrowing was £158.3 billion (or 10.2% of GDP).
Figure 4 shows annual borrowing has generally been falling since its peak in the FYE March 2010 (April 2009 to March 2010).
Figure 4: Borrowing has generally been falling since its peak in the financial year ending March 2010
Public sector net borrowing excluding public sector banks, UK, April 1993 to January 2020

Source: Office for National Statistics – Public Sector Finances
Notes:
- The Office for Budget Responsibility (OBR) full financial year forecast of PSNB ex for the FYE March 2020, taken from the Restated March 2019 Forecast, published in December 2019.
- Financial year 2018/19 represents the financial year ending 2019 (April 2018 to March 2019).
- YTD equals year-to-date (April to January).
Download this image Figure 4: Borrowing has generally been falling since its peak in the financial year ending March 2010
.png (83.5 kB) .xls (86.0 kB)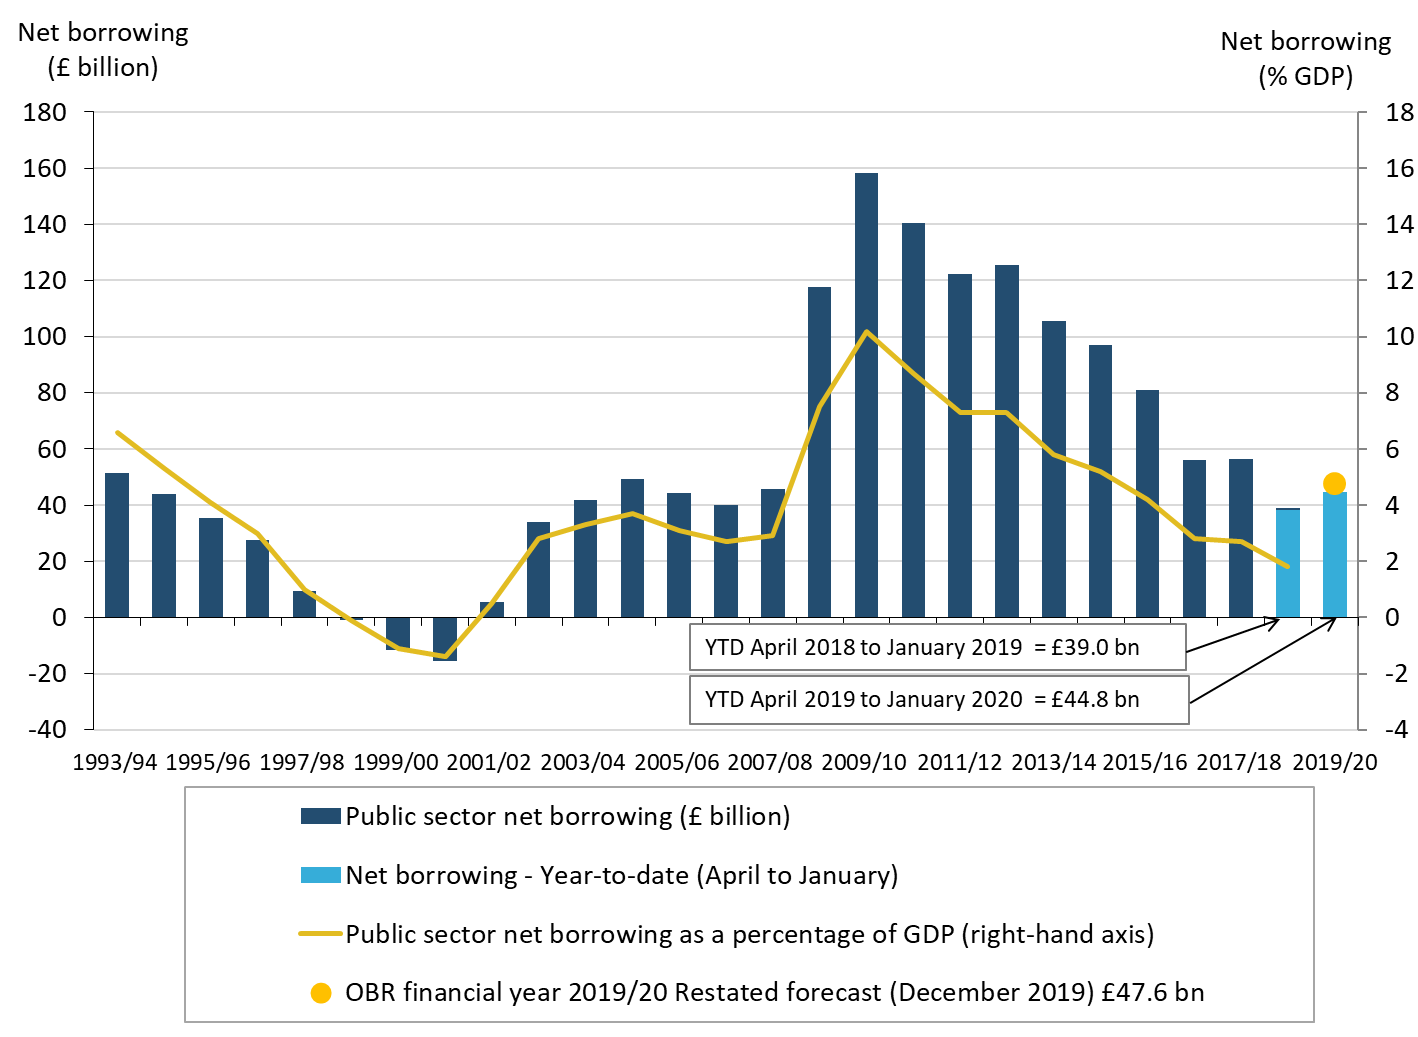
3. Debt
Public sector net debt excluding public sector banks (PSND ex) (or national debt) represents the total amount of money the public sector owes to private sector organisations (including overseas institutions), less the amount of cash and other short-term assets it holds.
The national debt has been built up by successive government administrations over many years.
When the government borrows, this normally adds to the total debt, but it is important to remember that reducing the deficit is not the same as reducing the debt.
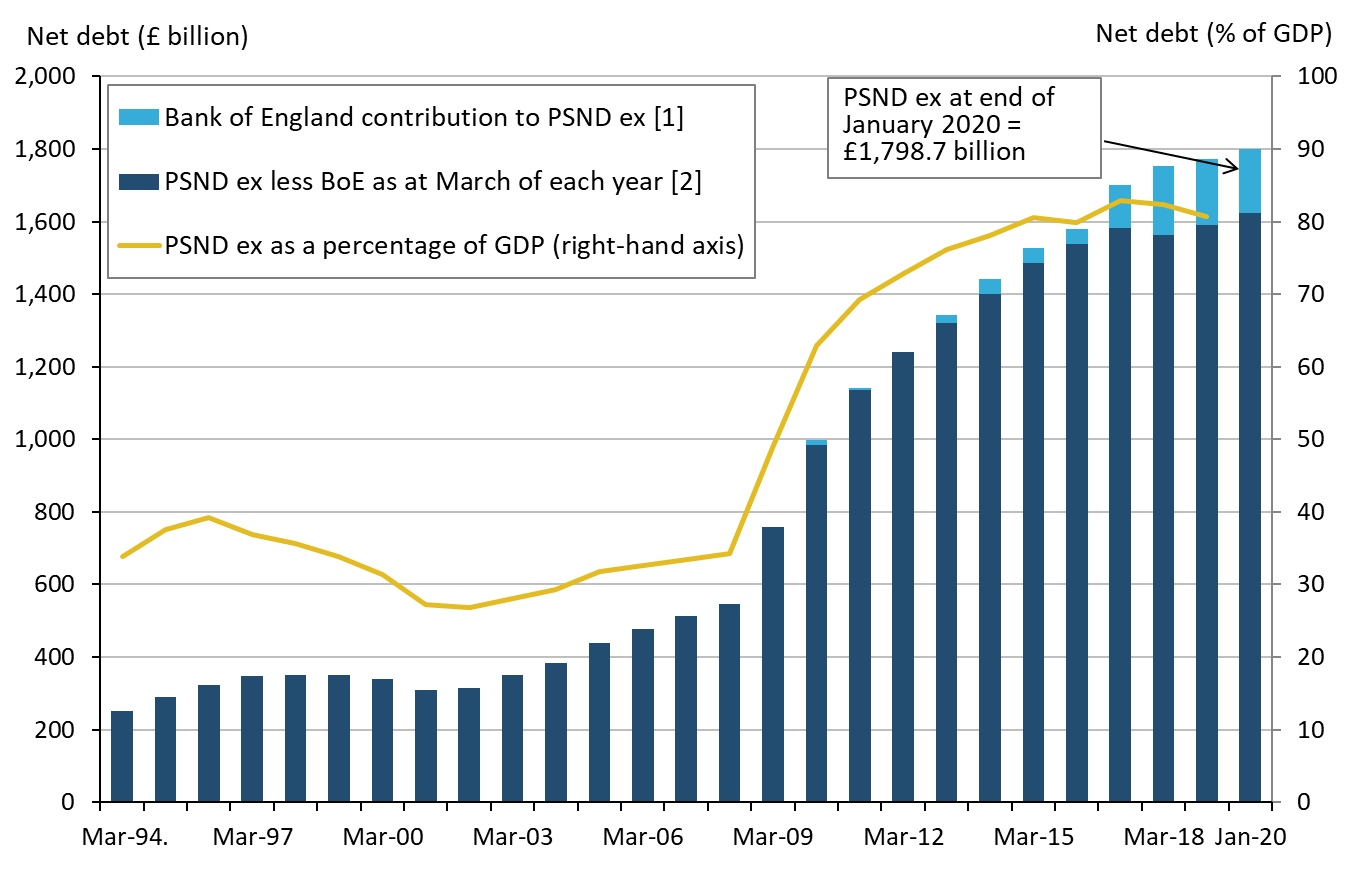
At the end of January 2020, the amount of money owed by the public sector to the private sector stood at approximately £1.8 trillion (or £1,798.7 billion) (Figure 5), which equates to 79.6% of gross domestic product (GDP) (the value of all the goods and services currently produced by the UK economy in a year).
Though debt has increased by £41.4 billion on January 2019, the ratio of debt to GDP has decreased by 0.7 percentage points, implying that UK GDP is currently growing at a faster rate than debt.
Figure 5: Debt as a percentage of gross domestic product (GDP) has been falling in recent financial years
Public sector net debt (excluding public sector banks), UK, March 1994 to the end of January 2020
Source: Office for National Statistics – Public Sector Finances
Notes:
- Includes Asset Purchase Facility (APF), which includes the Term Funding Scheme (TFS).
- PSND ex is the combination of PSND ex Bank of England plus Bank of England. contribution to PSND ex.
- Public sector net debt excluding public sector banks (PSND ex) shown at the end of each financial year (March), unless otherwise stated.
Download this image Figure 5: Debt as a percentage of gross domestic product (GDP) has been falling in recent financial years
.png (64.9 kB) .xls (73.7 kB)
The Bank of England’s (BoE’s) contribution to net debt is largely a product of their quantitative easing measures, namely the Bank of England Asset Purchase Facility Fund (BEAPFF) and the Term Funding Scheme (TFS). If we were to exclude the BoE from our calculation of PSND ex, it would reduce by £173.8 billion, from £1,798.7 billion to £1,624.9 billion, or from 79.6% of GDP to 72.0%.
Figure 6 breaks down outstanding public sector net debt (PSND) at the end of January 2020 into the sub-sectors of the public sector. In addition to PSND ex, this presentation includes the effect of public sector banks on debt.
Figure 6: How each sector contributes to debt, UK
At end of January 2020
Source: Office for National Statistics – Public Sector Finances
Notes:
- PSND - Public sector net debt.
- PSND ex - Public sector net debt excluding public sector banks.
- PSND ex less BoE - Public sector net debt excluding both public sector banks and Bank of England.
Download this chart Figure 6: How each sector contributes to debt, UK
Image .csv .xlsFigure 7 incorporates the borrowing components detailed in Figure 3 to show how the differences between income and spending (both current and capital) have led to the accumulation of debt in the current financial year-to-date (April 2019 to January 2020).
The reconciliation between public sector net borrowing (PSNB) and the net cash requirement is presented in more detail in Table REC1 in the Public sector finances tables 1 to 10: Appendix A dataset.
Figure 7: How the differences in expenditure and receipts affect public sector net debt (excluding public sector banks), UK
UK, current financial year-to-date (April 2019 to January 2020)

Source: Office for National Statistics – Public Sector Finances
Notes:
- Cash transactions in (non-financing) financial assets, which do not impact on net borrowing.
- Timing differences between cash and accrued data.
- Revaluation of foreign currency debt (for example, foreign currency) Debt issuances or redemptions above or below debt valuation (for example, bond premia/discounts and capital uplifts). Changes in volume of debt not due to transactions (for example, sector reclassification).
Download this image Figure 7: How the differences in expenditure and receipts affect public sector net debt (excluding public sector banks), UK
.png (112.9 kB) .xls (63.5 kB)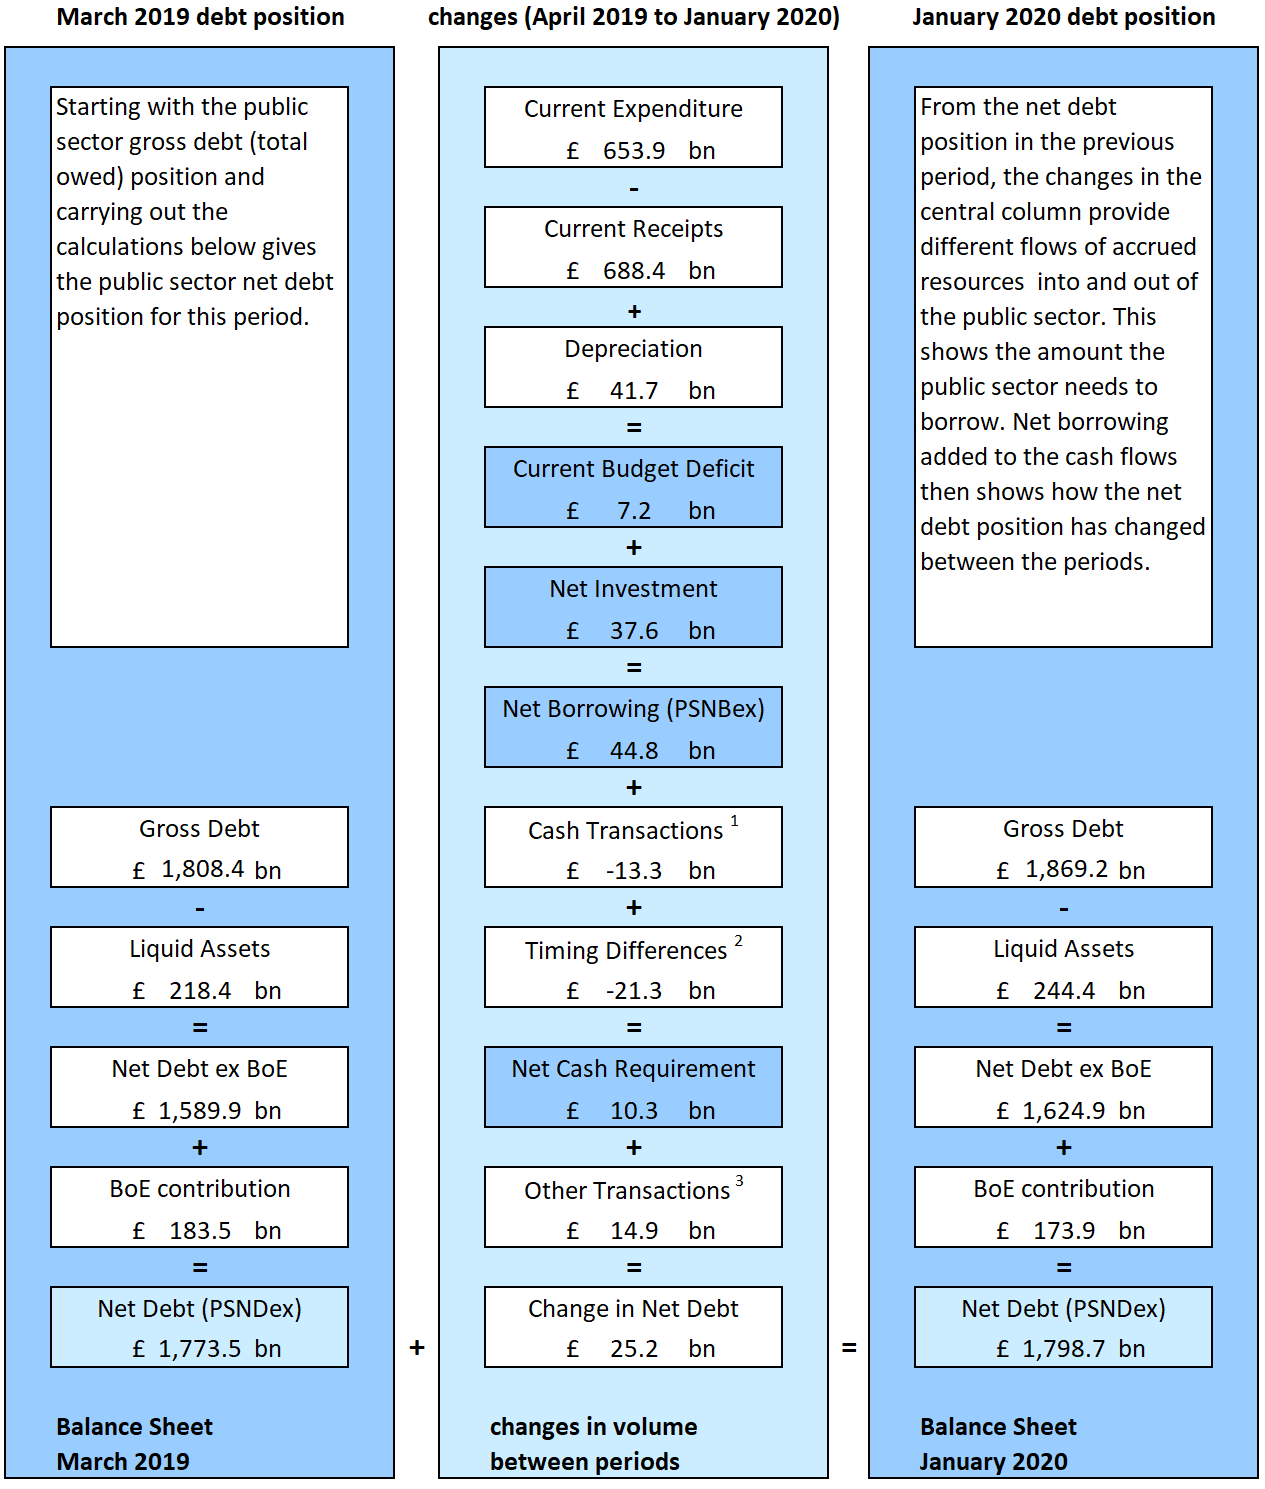
4. Revisions
Revisions can be the result of both updated data sources and methodology changes. This month, revisions to public sector finance statistics are a result of updated data only.
Revisions summary
Table 1 shows the revisions to the headline statistics presented in this bulletin compared with those presented in the previous bulletin (published on 22 January 2020).
| £ billion¹ (not seasonally adjusted) | |||||||||
|---|---|---|---|---|---|---|---|---|---|
| Net borrowing | |||||||||
| Period | CG² | LG³ | NFPCs⁴ | PSP⁵ | BoE⁶ | PSNB ex⁷ | PSND ex⁸ | PSND % of GDP⁹ | PSNCR ex¹⁰ |
| 2016/17 | 0.0 | 0.0 | 0.0 | 0.0 | 0.0 | 0.0 | 0.0 | 0.0 | 0.0 |
| 2017/18 | 0.0 | 0.4 | 0.0 | 0.0 | 0.0 | 0.4 | -0.1 | 0.0 | 0.0 |
| 2018/19 | 0.4 | 0.0 | 0.0 | 0.0 | 0.0 | 0.4 | -0.1 | 0.0 | 0.0 |
| 2019/20 y-t-d¹² | -0.7 | 0.3 | 0.4 | 0.0 | 0.0 | 0.0 | -0.1 | 0.0 | 0.2 |
| 2019 Apr | -0.1 | 0.1 | 0.0 | 0.0 | 0.0 | 0.0 | -0.1 | 0.0 | 0.0 |
| 2019 May | -0.1 | 0.1 | 0.0 | 0.0 | 0.0 | 0.0 | -0.1 | 0.0 | 0.0 |
| 2019 Jun | 0.1 | 0.1 | 0.0 | 0.0 | 0.0 | 0.2 | -0.1 | 0.0 | 0.0 |
| 2019 Jul | 0.0 | 0.0 | 0.0 | 0.0 | 0.0 | 0.0 | -0.1 | 0.0 | 0.0 |
| 2019 Aug | 0.2 | 0.0 | 0.0 | 0.0 | 0.0 | 0.2 | -0.1 | 0.0 | 0.0 |
| 2019 Sep | 0.0 | 0.0 | 0.0 | 0.0 | 0.0 | 0.0 | -0.1 | 0.0 | 0.0 |
| 2019 Oct | 0.1 | 0.0 | 0.1 | 0.0 | 0.0 | 0.1 | -0.1 | 0.0 | 0.0 |
| 2019 Nov | -0.1 | -0.1 | 0.1 | 0.0 | 0.0 | -0.1 | -0.1 | 0.0 | 0.0 |
| 2019 Dec | -0.9 | 0.2 | 0.1 | 0.0 | 0.0 | -0.6 | -0.1 | 0.0 | 0.2 |
Download this table Table 1: Revisions to main aggregates
.xls .csvRevisions to public sector net borrowing excluding public sector banks in the current financial year-to-date (April to December 2019)
The data for the latest months of every release contain a degree of forecasts. The initial outturn estimates for the early months of the financial year, particularly April, contain more forecast data than other months. This is because profiles of tax receipts, along with departmental and local government spending, are still provisional. This means that the data for these months are typically more prone to revision than other months and can be subject to sizeable revisions in later months.
Public sector net borrowing excluding public sector banks (PSNB ex) in the current financial year-to-date (April to December 2019) remains largely unchanged compared with figures presented in the previous bulletin (published on 22 January 2020), but there are offsetting revisions to the components of borrowing.
Over this period, a £0.7 billion downward revision to central government net borrowing was offset by upward revisions to local government and public corporations’ net borrowing of £0.3 billion and £0.4 billion respectively.
VAT refunds
Updates to Value Added Tax (VAT) refund data account for £0.4 billion of the overall £0.6 billion revision to accrued VAT receipts in the current financial year-to-date. Any update to VAT refund data are accompanied by an equal and offsetting update to central government departments’ expending on goods and services and so have no impact on borrowing.
Central government receipts
Regular data updates have led to central government receipts increasing by £0.4 billion. Notably, a £0.6 billion increase to previous estimates of VAT (see previous) has been partially offset by a reduction of £0.3 billion in income-related receipts (Income Tax and National Insurance contributions).
An upward revision to receipts exerts a downward pressure on previous borrowing estimates.
Central government current expenditure
Central government current expenditure increased by £0.2 billion, with increases in previous estimates of departmental spending on goods and services (£0.6 billion) (see previous) and subsidies (£0.3 billion), being partially offset with reductions in debt interest (£0.3 billion) and current grants to local government (£0.3 billion). An upward revision to current expenditure exerts an upward pressure on previous borrowing estimates.
Central government net investment
Previous estimates of gross capital formation and capital transfers to the private sector have been reduced by £0.3 billion and £0.2 billion respectively, leading to a reduction in central government net investment of £0.5 billion. Again, these revisions were because of regular data updates. A downward revision to net investment exerts a downward pressure on previous borrowing estimates.
Local government
While the £0.3 billion reduction in current grants to local government in the current financial year-to-date reduced central government borrowing, this reduction in transfers has an equal but opposite effect on local government borrowing, increasing it by £0.3 billion across the same period.
Public corporations
On 31 January 2020, the Ministry of Housing, Communities and Local Government (MHCLG) published an update to the local authority capital expenditure and receipts forecast for the financial year ending March 2020 to correct misreported capital receipts for the Housing Revenue Account. This update has led to an upward revision of £0.4 billion to public corporations’ net borrowing in the current financial year-to-date. This revision has had no impact on local government net borrowing, because the Housing Revenue Account (council housing) is classified within the public corporations sub-sector.
Figure 8 summarises the revisions to PSNB ex by sub-sector, comparing the latest estimates of borrowing with those presented in the previous bulletin (published on 22 January 2020). This presentation splits the revisions to PSNB ex into each of its five sub-sectors: central government, local government, non-financial public corporations, public sector pensions and the Bank of England (BoE).
Figure 8: How each element of the public sector contributes to the revision in financial year-to-date net borrowing (PSNB ex)
Latest data covering April to December 2019, compared with that presented in the previous bulletin (published on 22 January 2020), UK

Source: Office for National Statistics – Public Sector Finances
Notes:
- PSNB ex - Public sector net borrowing excluding public sector banks.
- CGNB - Central government net borrowing.
- LGNB - Local government net borrowing.
- PCNB - Non-financial public corporations' net borrowing.
- BoENB - Bank of England net borrowing.
- L&P - Land and property.
- I&W - Income and wealth.
- NICs - National insurance contributions.
- Contributions to EU - UK VAT, GNI and abatement contributions to the EU budget.
- o/w - Of which.
Download this image Figure 8: How each element of the public sector contributes to the revision in financial year-to-date net borrowing (PSNB ex)
.png (148.5 kB) .xls (96.3 kB)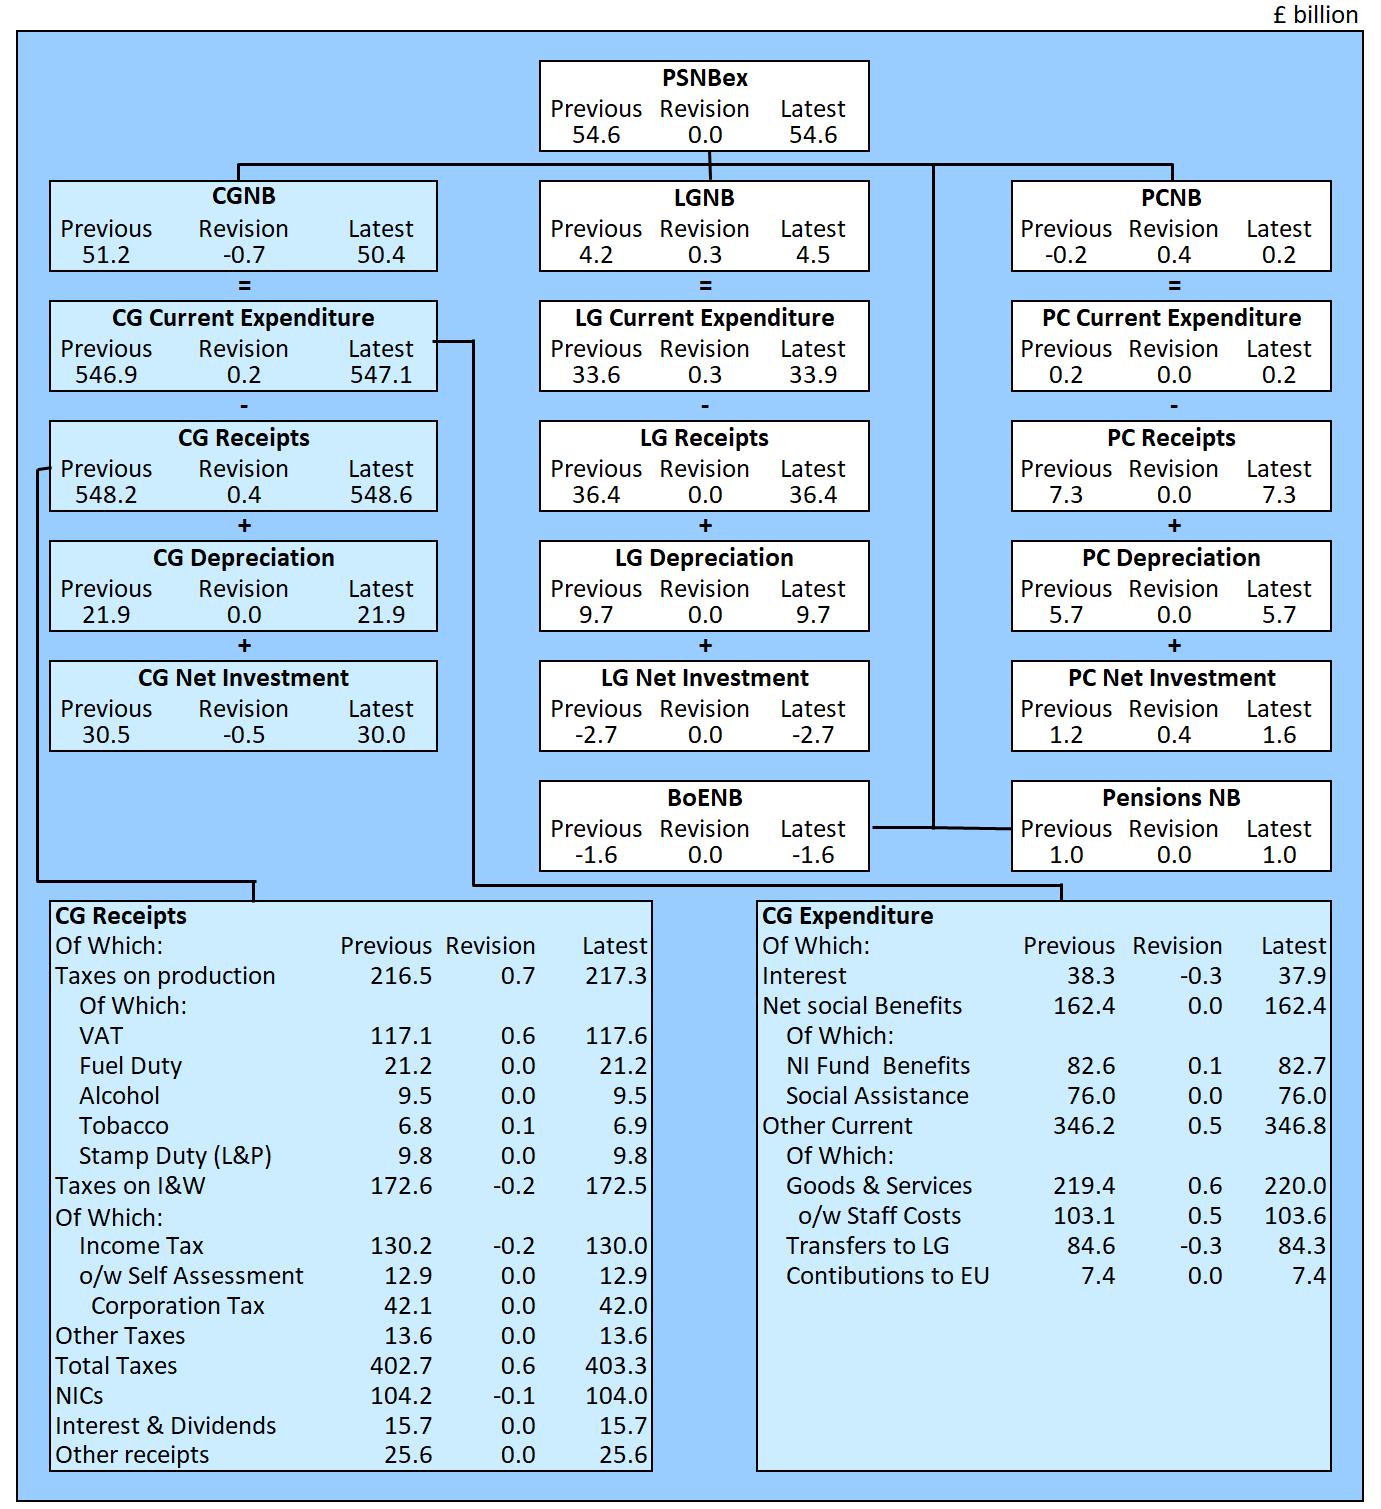
Revisions to public sector net borrowing excluding public sector banks in earlier financial years
Since the last publication (22 January 2020), previous estimates of public sector net borrowing have been revised upwards by £0.4 billion in both the financial years ending March 2019 and March 2018.
In the financial year ending March 2019, previous estimates of Corporation Tax and penalties for non-payment of taxes have decreased by £0.3 billion and £0.1 billion respectively across the period, increasing central government net borrowing (and so PSNB ex) by £0.4 billion.
In the financial year ending March 2018, previous estimates of capital grants between local government and the private sector have increased across the period, increasing local government net borrowing (and so PSNB ex) by £0.4 billion.
Revisions to public sector net debt excluding public sector banks
Public sector net debt excluding public sector banks (PSND ex) at the end of December 2019 has reduced by £0.1 billion compared with that presented in the previous bulletin (published on 22 January 2020) because we have updated the level of foreign currency assets held by the Debt Management Office as at August 2017.
Revisions to public sector net cash requirement excluding public sector banks
Public sector net cash requirement excluding public sector banks (PSNCR ex) in the current financial year-to-date has been revised upwards by £0.2 billion, largely as a result of regular central government data updates.
Back to table of contents5. Public sector finances data
Public sector finances borrowing by sub-sector
Dataset | Released 24 February 2020
An extended breakdown of public sector borrowing in a matrix format and estimates of total managed expenditure (TME).
Public sector finances tables 1 to 10: Appendix A
Dataset | Released 21 February 2020
The data underlying the public sector finances statistical bulletin are presented in the tables PSA 1 to 10.
Public sector finances revisions analysis on main fiscal aggregates: Appendix C
Dataset | Released 21 February 2020
Revisions analysis for central government receipts, expenditure, net borrowing and net cash requirement statistics for the UK over the last five years.
Public sector current receipts: Appendix D
Dataset | Released 21 February 2020
A breakdown of UK public sector income by latest month, financial year-to-date and full financial year, with comparisons with the same period in the previous financial year.
Impact of student loans, public sector-funded pension scheme changes and capital consumption changes introduced in September 2019: Appendix G
Dataset | Released 21 February 2020
Latest estimates of PSNB (and further into current budget deficit and net investment spending), net debt and net financial liabilities, with the impacts of changes to the accounting for student loans, public sector pensions and capital consumption introduced in September 2019.
All datasets related to this publication are available on our website.
6. Glossary
The public sector
In the UK, the public sector consists of six sub-sectors: central government, local government, public non-financial corporations, public sector pensions, the Bank of England and public financial corporations (or public sector banks).
Public sector current budget deficit
Public sector current budget is the difference between revenue (mainly from taxes) and current expenditure, on an accrued basis; it is the gap between current expenditure and current receipts (having taken account of depreciation). The current budget is in surplus when receipts are greater than expenditure.
Public sector net investment
Net investment refers to the balance of acquisition less disposals of capital assets and liabilities.
Public sector net borrowing
Public sector net borrowing excluding public sector banks (PSNB ex) measures the gap between revenue raised (current receipts) and total spending (current expenditure plus net investment (capital spending less capital receipts)). Public sector net borrowing (PSNB) is often referred to by commentators as “the deficit”.
Public sector net cash requirement
The public sector net cash requirement (PSNCR) represents the cash needed to be raised from the financial markets over a period of time to finance the government’s activities. This can be close to the deficit for the same period; however, there are some transactions, for example, loans to the private sector, that need to be financed but do not contribute to the deficit. It is also close but not identical to the changes in the level of net debt between two points in time.
Public sector net debt
Public sector net debt excluding public sector banks (PSND ex) represents the amount of money the public sector owes to private sector organisations including overseas institutions, largely as a result of issuing gilts and Treasury Bills, minus the amount of cash and other short-term assets it holds. Public sector net debt (PSND) is often referred to by commentators as “the national debt”.
Other important terms commonly used to describe public sector finances are listed in the public sector finance glossary.
Back to table of contents7. Measuring the data
The public sector finances methodological guide provides comprehensive contextual and methodological information concerning the monthly public sector finances statistical bulletin. The guide sets out the conceptual and fiscal policy context for the bulletin, identifies the main fiscal measures, and explains how these are derived and interrelated. Additionally, it details the data sources used to compile the monthly estimates of the fiscal position.
Departure from the European Union
As the UK leaves the European Union (EU), it is important that our statistics continue to be of high quality and are internationally comparable. During the transition period, those UK statistics that align with EU practice and rules will continue to do so in the same way as before 31 January 2020.
These statistics, and our sector classification process, draw on the European System of Accounts (ESA) 2010, the Manual on Government Deficit and Debt, and associated guides.
After the transition period, we will continue to produce our public sector finance statistics in line with the UK Statistics Authority’s Code of Practice for Statistics and in accordance with internationally agreed statistical guidance and standards.
To ensure comparability with other countries, the statistical aggregates within the public sector finances release will continue to be produced according to the existing definitions and standards until further notice or those standards are updated.
Recent and upcoming changes to public sector finance statistics
Article | Released 21 February 2020
This article explains the main methodology changes introduced to public sector finance statistics in September 2019 and their impact on our headline measures. It also provides information about improvements to data or methodology that are planned but not yet included in the public sector finances.
8. Strengths and limitations
Information on the strengths, limitations, appropriate uses, and how the data were created is available in the Public sector finances Quality and Methodology Information (QMI).
Local government
Local government data for the financial year ending (FYE) March 2020 are mainly based on budget data for England, Wales and Scotland, and estimates for Northern Ireland.
In recent years, planned expenditure initially reported in local authority budgets has been systematically higher than the final outturn expenditure reported in the audited accounts. We therefore include adjustments to reduce the amounts reported at the budget stage.
For the FYE March 2020, we include a £2.0 billion downward adjustment to England’s current expenditure on goods and services, along with £0.7 billion and £0.2 billion adjustments to Scotland’s and Wales’ capital expenditure respectively. We apply a further £2.6 billion downward adjustment to current expenditure on benefits in the FYE March 2020, to reflect the most recently available data for housing benefits.
Further information on these and additional adjustments can be found in the Public sector finances QMI.
Current and capital transfers between this sector and central government are based on administrative data supplied by HM Treasury.
Non-financial public corporations
Public corporations data for the FYE March 2020 remain initial estimates, based on the Office for Budget Responsibility (OBR) forecasts. Current and capital transfers between this sector and central government are based on administrative data supplied by HM Treasury.
Public sector funded pensions
Pensions data for the for FYE March 2020 are our estimates based on the latest available data. Some of these estimates rely on actuarial modelling; this is a complex process that most public sector schemes conduct every three to four years. Until such valuations become available, we forecast the change in pension liability using our knowledge of the economic climate. Pensions in the public sector finances: a methodological guide outlines both the theory and practice behind our calculation of pension scheme estimates.
Public sector banks
Unless otherwise stated, the figures quoted in this bulletin exclude public sector banks (that is, currently only Royal Bank of Scotland, RBS).
The reported position of debt, and to a lesser extent borrowing, would be distorted by the inclusion of RBS’s balance sheet (and transactions). This is because the government does not need to borrow to fund the debt of RBS, nor would surpluses achieved by RBS be passed on to the government, other than through any dividends paid as a result of the government equity holdings.
Comparability with official forecasts
The independent Office for Budget Responsibility (OBR) is responsible for the production of official forecasts for government. These forecasts are usually produced twice a year, in spring and autumn.
On 7 January 2020 it was announced that a Budget will be held on Wednesday 11 March 2020.
The Budget, or Financial Statement, is a statement made to the House of Commons by the Chancellor of the Exchequer on the nation’s finances and the government’s proposals for changes to taxation and spending. The Budget also includes forecasts for the economy made by the OBR.
On 16 December 2019, the OBR published a technical restatement of their March 2019 forecast for the public finances. This brings their forecast into line with current Office for National Statistics (ONS) statistical treatment, for example, to include the new treatment of student loans implemented in September 2019. These restated forecasts are reflected in this bulletin.
Table 2 compares forecasts for the main fiscal aggregates published in the OBR’s Economic and fiscal outlook (EFO) for March 2019 for the financial year ending (FYE) March 2020 with those presented in the December 2019 technical restatement. These restated forecasts are reflected in this bulletin.
| £ billion (unless otherwise stated) | |||||
|---|---|---|---|---|---|
| Current budget deficit | Net investment | Net borrowing | Net debt¹ | Net debt %GDP¹ | |
| March 2019 EFO² | -17.7 | 47.0 | 29.3 | 1,838.2 | 82.2 |
| December 2019 restatement | -2.5 | 50.2 | 47.6 | 1,817.0 | 81.3 |
Download this table Table 2: Restated OBR forecasts of key public sector aggregates for the financial year ending March 2020
.xls .csvTable 3 compares the current outturn estimates for each of our main public sector excluding public sector banks aggregates for the current financial year-to-date with the corresponding latest OBR forecasts for the following financial year. In addition, Table 3 compares the latest full financial year (April 2018 to March 2019) outturn estimates with those of the previous financial year.
| Excluding public sector banks | £ billion¹ (not seasonally adjusted) | |||||
|---|---|---|---|---|---|---|
| Financial year-to-date⁷ | Full financial year | |||||
| 2018/19 | 2019/20 | % change | 2018/19⁸ outturn | 2019/20 OBR forecast⁹ | % change | |
| Current budget deficit² | 5.6 | 7.2 | 28.2 | -5.8 | -2.5 | 56.9 |
| Net investment³ | 33.4 | 37.6 | 12.6 | 44.2 | 50.2 | 13.6 |
| Net borrowing⁴ | 39.0 | 44.8 | 14.9 | 38.4 | 47.6 | 24.0 |
| Net debt⁵ | 1,757.3 | 1,798.7 | 2.4 | 1,773.5 | 1,817.0 | 2.5 |
| Net debt as a percentage of GDP⁶ ¹⁰ | 80.3 | 79.6 | -0.7 | 80.7 | 81.3 | 0.6 |
Download this table Table 3: Latest outturn estimates compared with the OBR forecasts
.xls .csvCaution should be taken when comparing public sector finances data with the OBR figures for the full financial year. Data are not finalised until sometime after the financial year ends, with initial estimates made soon after the end of the financial year often subject to sizeable revisions in later months as forecasts are replaced with audited outturn data. There may also be known methodological differences between the OBR forecasts and outturn data.
Consistency with other publications
On 17 January 2020, we published UK government debt and deficit: September 2019, consistent with Public sector finances, UK: November 2019 (published on 20 December 2019). In this publication, we stated that:
general government gross debt was £1,821.9 billion at the end of the financial year ending (FYE) March 2019, equivalent to 84.0% of gross domestic product (GDP); this is 24.0 percentage points above the Maastricht reference value of 60.0%
general government deficit (or net borrowing) was £38.7 billion in the FYE March 2019, equivalent to 1.8% of GDP; this is 1.2 percentage points below the Maastricht reference value of 3.0%
This bulletin reports a small revision to deficit compared with those figures submitted on 20 December 2019, with deficit in the FYE March 2019 now standing at £38.9 billion. The published estimate of debt remains unchanged.
It is important to note that the GDP measure used as the denominator in the calculation of the debt ratios in the UK government debt and deficit statistical bulletin differs from that used within the Public sector finances statistical bulletin.
Back to table of contents