Table of contents
- Main points
- Statistician’s comment
- Summary
- Including indirect imports in estimates of import intensity of CPIH
- Food and energy prices are having an upward effect on CPIH following a period of deflation
- A range of input producer prices continue to be associated with changes in the sterling exchange rate
- Average house price growth in Great Britain remains relatively flat and below the longer-term average
1. Main points
The 12-month growth rate for consumer prices including owner occupiers’ housing costs (CPIH) has remained, for the second month, at 2.7% in the 12 months to January 2018.
Since the end of 2016, most of the increases in CPIH have been driven by the more import-intensive categories and energy.
Food and energy prices are having an upward effect on CPIH following a sustained period of deflation between November 2014 and September 2016 for energy, and between July 2014 and January 2017 for food.
The price paths of the inputs used to produce commodity-based manufacturing products such as oil and metal goods continue to be associated with changes in the sterling exchange rate.
Average house price growth in London, and Great Britain excluding London in December 2017 remains below the longer-term average for Great Britain as a whole.
2. Statistician’s comment
Commenting on today's inflation figures, ONS senior statistician James Tucker said:
"Headline inflation was unchanged with petrol prices rising by less than this time last year. However, the cost of entry to attractions such as zoos and gardens fell more slowly. After rising strongly since the middle of 2016, food price inflation now appears to be slowing.
"Factory goods price inflation continued to slow, with food prices falling in January. The growth in the cost of raw materials also slowed, with the prices of some imported materials falling.
"House price growth increased slightly, driven by rises in Scotland and the South West. By contrast, annual house price growth in London was the lowest of any region in the UK for the third consecutive month."
Back to table of contents3. Summary
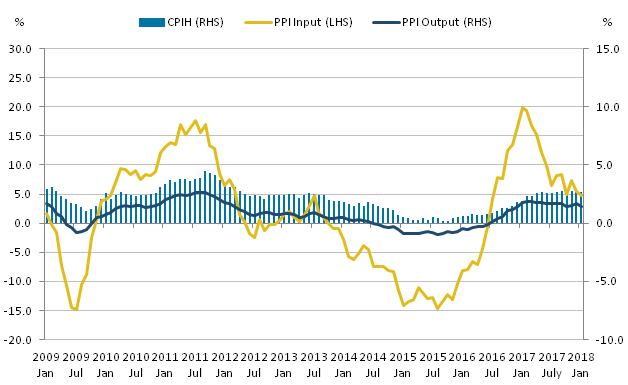
Figure 1 shows the 12-month growth in the Consumer Prices Index including owner occupiers’ housing costs (CPIH) remained at 2.7% in January 2018. The Input Producer Prices Index (input PPI) grew by 4.7% in the 12 months to January 2018, down from 5.4% in the 12 months to December 2017. The output Producer Prices Index (output PPI) grew by 2.8% in the 12 months to January 2018, down from 3.3% in the 12 months to December 2017.
Figure 1: Annual growth rate for Producer Price Index (PPI) input (left-hand side), PPI output and Consumer Prices Index including owner occupiers' housing costs (CPIH) (right-hand side)
UK, January 2009 to January 2018
Source: Office for National Statistics
Notes:
- These data are also available within the Dashboard: Understanding the UK economy.
Download this image Figure 1: Annual growth rate for Producer Price Index (PPI) input (left-hand side), PPI output and Consumer Prices Index including owner occupiers' housing costs (CPIH) (right-hand side)
.png (19.6 kB) .xls (33.8 kB)
Data tables accompanying this commentary include contributions to the 12-month growth rate of output and input PPI, contributions to the 12-month growth rate of CPIH and CPI (Consumer Prices Index) by direct and total import intensity of goods and services, and import penetration tables for CPI and CPIH by direct and total import intensity of goods and services. This analysis has recently been updated following the publication of the January 2018 Economic Review, which is discussed more in Section 4 of this release.
Back to table of contents4. Including indirect imports in estimates of import intensity of CPIH
Previous economic commentaries have included analysis on the direct import intensity of the Consumer Prices Index including owner occupiers’ housing costs (CPIH) basket of goods and services (that is, the proportion of these items that have been imported). Using these estimates we can, for example, look at whether goods and services with higher import intensity are contributing more to the 12-month growth rate of CPIH following the movements in the exchange rate over the last couple of years.
In the January 2018 Economic Review, the methodology of calculating import intensity was expanded from just direct import intensity to including both direct and indirect import intensity (that is, the imported content of goods and services that are produced in the UK for household consumption). For example, restaurants have 0% direct import intensity, but 15.1% indirect import intensity because of the imported content of the food and drink that they serve. The data sources were also reviewed and updated to include the most recent data. For more information around this methodology, including an overview of the caveats and assumptions you should be aware of before using these data, please see the full article in the Economic Review.
This analysis results in a total import intensity estimate for each category in the CPIH basket. These goods and services, as previously, are then grouped together into the import intensity buckets used in Figure 21, which shows the contributions to the 12-month growth in CPIH from these buckets.
Figure 2: CPIH contributions by purchasers' price total import intensity groups and owner occupiers' housing costs (OOH) and energy
UK, January 2006 to January 2018
Source: Office for National Statistics
Download this chart Figure 2: CPIH contributions by purchasers' price total import intensity groups and owner occupiers' housing costs (OOH) and energy
Image .csv .xlsMost of the recent increases in CPIH since the end of 2016 have been driven by the more import-intensive categories and energy. For example, between August 2016 and January 2018, CPIH increased from 1.0% to 2.7%, but 88.7% of that increase was driven by increases in the contributions of 25% to 40%, 40% and over and energy import-intensity categories.
The Economic Review also used these estimates of import intensities for household consumption to calculate the import intensity of the expenditure baskets of different household groups. It found that consumption goods in the highest import-intensity bucket have contributed more strongly to the inflation rate of all household groups over the period since the end of 2016, but there appear to be offsetting factors at play, that mean that overall the difference in the contributions is small between different household groups.
This month is the first publication of a new quarterly update for these CPIH-consistent inflation rates for different household groups, covering the period Quarter 1 (Jan to Mar) 2015 to Quarter 4 (Oct to Dec) 2017. More detailed analysis will be included in the annual update, to be published in May 2018.
Notes for: Including indirect imports in estimates of import intensity of CPIH
- These have been adjusted slightly to reflect better the total import intensity estimates. The groups are now 0 to 10%, 10% to 25%, 25% to 40% and 40% and over. Energy (gas, electricity and fuels and lubricants) has also been separated out, as well as owner occupiers’ housing costs (OOH).
5. Food and energy prices are having an upward effect on CPIH following a period of deflation
To investigate these increases from high import-intensive categories further, we can look at two of these groups in more detail: food and energy. Figure 3 shows 12-month growth rates for Consumer Prices Index including owner occupiers’ housing costs (CPIH), the food component of CPIH and the energy grouping in CPIH (which includes fuels and lubricants, electricity, gas, liquid fuels and solid fuels), as well as the inverted sterling effective exchange rate from January 2014 to January 2018. These data illustrate trends in the value of sterling (inverted), consumer price growth, and consumer price growth for food and energy respectively.
Figure 3: 12-month growth rates of CPIH, energy and food components of CPIH and the inverted sterling effective exchange rate
UK, January 2014 to January 2018
Source: Office for National Statistics
Download this chart Figure 3: 12-month growth rates of CPIH, energy and food components of CPIH and the inverted sterling effective exchange rate
Image .csv .xlsEnergy prices have been growing since October 2016, following a sustained period of deflation between November 2014 and September 2016. Food saw an even longer period of deflation between July 2014 and January 2017. Energy and food prices were generally both having a negative contribution to the headline rate of CPIH during these periods of deflation.
Since January 2015, trends in energy prices have followed a broadly similar trend to the sterling-inverted exchange rate but with a possible lagged effect as exchange rate changes take time to feed through into renewed contracts. Changes in world commodity prices and domestic pressures also exert considerable influence on the consumer price of energy. For example, the price of Brent crude oil in pounds sterling, which is a relatively volatile series, influences trends in the fuels and lubricants component of CPIH. Recently, it has been driven largely by changes in the dollar price rather than exchange rate effects.
Recent analysis has also highlighted the limited feed-through to consumer prices from wholesale gas and electricity prices (which are closer to world prices) and showed that in particular falls in wholesale and input prices were not translated into equivalent falls in consumer prices for gas and electricity. An independent Cost of Energy Review (PDF, 6.55MB) for the UK was published in October 2017, identifying that consumers’ electricity energy prices are higher than would be expected based on underlying costs and highlighting complex regulations, legacy costs and the structure of the market as likely explanations.
For the food component, the deflation from July 2014 to January 2017 may be due partly to the supermarket “price wars” in the UK over this period, which resulted in a downward pressure on food prices.
The growth in food prices seen in the UK in 2017 may be attributable partly to a further sterling depreciation between May and August 2017 feeding through gradually into consumer prices later in 2017. Food is a relatively import-intensive component with all classes within food having import intensity in the 25% to 40% category or 40% and over category, based on the new measure of import intensity including indirect imports. However, domestic conditions such as poor weather can also have considerable influence in consumer prices as seen from the supply and demand issues and rising input costs related to UK milk production in early 2017.
Back to table of contents6. A range of input producer prices continue to be associated with changes in the sterling exchange rate
Figure 4 shows the inverted sterling effective exchange rate and six selected components of the input Producer Price Index (PPI). The price paths of the inputs, such as crude oil and metal goods, that are used to produce commodity-based manufacturing products have been trending more closely to changes in the exchange rate between January 2011 and January 2018 than prices faced by the producers of other parts and equipment. The UK input prices for these imported commodities reflect changes in both world prices and the exchange rate.
Figure 4: Inverted sterling effective exchange rate (right-hand side) and selected input Producer Price Indices (left-hand side) by product
UK, January 2011 to January 2018

Source: Office for National Statistics
Download this image Figure 4: Inverted sterling effective exchange rate (right-hand side) and selected input Producer Price Indices (left-hand side) by product
.png (37.4 kB) .xls (27.1 kB)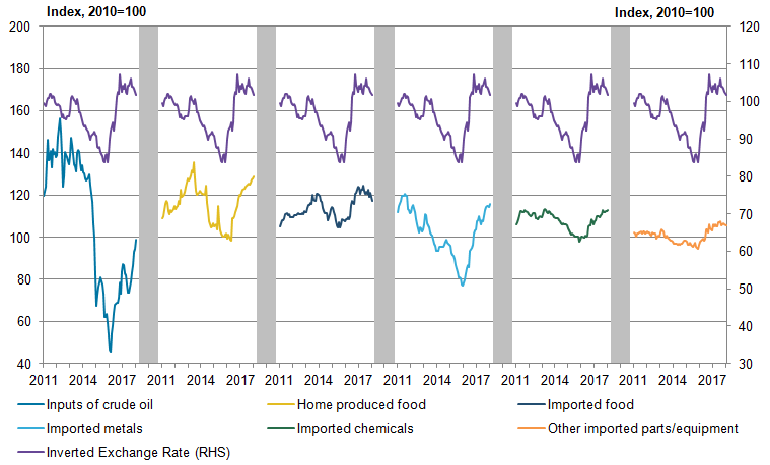
Crude oil inputs appear to trend with the exchange rate less than imported metals and chemicals as the world price of crude oil is relatively volatile and therefore accounts for more of the change in input prices over the period. Recent sharp increases in the prices of Brent crude oil reflect changes in the US dollar price feeding through into the sterling price. However, as imported inputs make up around two-thirds of the aggregate input PPI series the exchange rate has a relatively strong influence on overall input PPI.
Both imported and home-produced food seem to follow broadly changes in the exchange rate. This may reflect the nature of the food industry in the UK: these are products that can be fairly easily substituted between imports and domestic produce, and there is also limited scope to expand or reduce quickly domestic supply to meet changes in demand in the short-term.
In contrast, the price paths of the inputs used in the manufacture of other parts and equipment such as motor vehicles are seen to trend less with movements in the sterling effective exchange rate compared with other input PPI series. The manufacture of these goods uses a wider range of intermediate inputs than needed for the production of more commodity-based outputs. Overseas pricing strategy, competition and supply chain relationships as well as the exchange rate will therefore have a range of effects on input prices for these products and may be muting the relationship between these series and the effective sterling exchange rate.
Back to table of contents7. Average house price growth in Great Britain remains relatively flat and below the longer-term average
Using the House Price Index data for December 2017, we can compare price growth in 2017 and in previous years. Figure 5 shows the 12-month growth rate of the House Price Index for Great Britain excluding London, and London over the period January 2014 to December 2017, along with the average 12-month growth rate of Great Britain as a whole from 2014 to 2016. Following the fall in house prices after the economic downturn, the 12-month growth rate for Great Britain excluding London peaked at 8.1% in October 2014, with an average growth rate of 7.1% for Great Britain as a whole between January 2014 and December 2016.
Figure 5: 12-month growth rate of the House Price Index (HPI) for Great Britain excluding London, London and the average growth rate of Great Britain as a whole between 2014 and 2017
Great Britain, January 2014 to December 2017
Source: HM Land Registry, Office for National Statistics
Download this chart Figure 5: 12-month growth rate of the House Price Index (HPI) for Great Britain excluding London, London and the average growth rate of Great Britain as a whole between 2014 and 2017
Image .csv .xlsSince mid-2016, the growth in average house prices in Great Britain fell sharply from 7.8% to a low of 4.1% in March 2017. The dip in March 2017 reflects a base effect from the peak in March 2016, which previous analysis has attributed to changes in Stamp Duty.
Growth in house prices has started broadly to pick up in the second half of 2017 for Great Britain excluding London, ending the year at 5.6% in December. This remains lower than the average growth rate of 7.1% for Great Britain as a whole between January 2014 and December 2016, which has been the case since August 2016. In contrast, growth in London house prices remained more subdued throughout the second half of 2017, ending the year at 2.5% in December. The October and November edition of the UK Residential Market Survey (PDF, 598KB) by the Royal Institution of Chartered Surveyors (RICS) attribute this sustained lower growth to a number of factors including uncertainty over the economic climate and increases in the cost of moving and selling.
Figure 6: The House Price Index for selected English regions
January 2017 to December 2017
Source: HM Land Registry, Office for National Statistics
Download this chart Figure 6: The House Price Index for selected English regions
Image .csv .xlsThe average growth rate in house prices for Great Britain as a whole masks considerable variation in regional growth rates (Figure 6). London has had one of the lowest growth rates throughout 2017, experiencing only 1.8% growth between January and December 2017. In contrast, the West Midlands and East Midlands have typically had amongst the highest growth rates throughout 2017; growing by 7.0% and 7.4% respectively between January and December 2017.
The high growth rates of house prices seen in these regions between January and December 2017 can be attributed partially to the growth rates of house prices of some local authorities within the regions. For example, West Midlands local authorities Sandwell and Coventry experienced an average 12-month growth in house prices of 6.7% and 8.0% respectively between January and December 2017. Similarly, East Midlands local authorities Leicester and Corby saw average 12-month growth in house prices of 6.5% and 10.7% respectively across the same period. Previous analysis has noted that the housing market in London has not recovered as well as the rest of the country following the Stamp Duty change in March 2016 and had lower house price growth than the rest of Great Britain throughout 2017.
Back to table of contentsContact details for this Article
Related publications
- Consumer price inflation, UK: January 2018
- Producer price inflation, UK: January 2018
- UK House Price Index: December 2017
- Index of Private Housing Rental Prices, Great Britain: January 2018
- Construction output price indices (OPIs), UK: October to December 2017
- Services producer price inflation, UK: October to December 2017