1. Main points
- Consumer price inflation including owner occupiers’ housing costs (CPIH) rose to 2.7% in the 12 months to May 2017 while growth in the prices of goods leaving the factory gate has remained relatively flat since January 2017.
- The supply chains for a range of products manufactured in the UK, including motor vehicles, became more import-intensive between 2010 and 2013 – leading to input prices more closely reflecting movements in the sterling effective exchange rate for these products compared with less import-intensive products.
- Falls in property transaction volumes in London in particular are feeding through into lower average house price growth.
2. Statistician's quote
Commenting on today's inflation figures, ONS Deputy National Statistician Jonathan Athow said:
"The latest rise in CPIH takes it to its highest rate since April 2012. The biggest upward factor was rising prices for recreational and cultural goods and services, particularly games, toys and hobbies.
"The rate of increase in factory gate prices has levelled now that manufacturing input costs have started to fall back.
"Meanwhile, house prices continued to rise into April, albeit at a slightly slower rate than the 2016 average."
Back to table of contents3. Summary
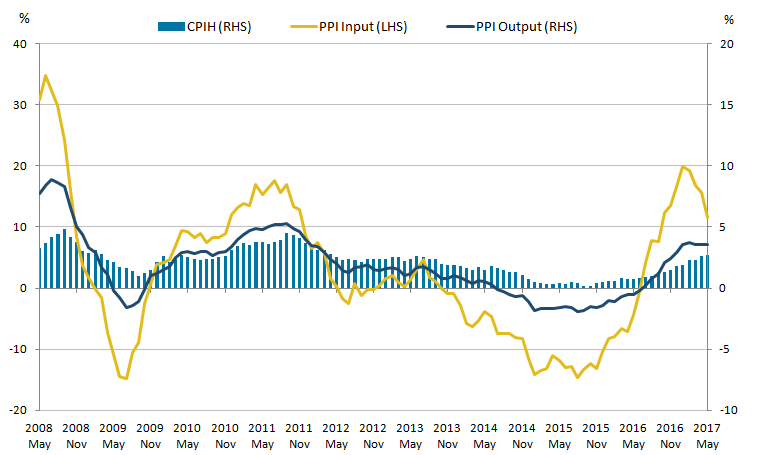
Figure 1 shows that the input Producer Price Index (PPI) increased by 11.6% in the 12 months to May 2017, down from 15.6% in the 12 months to April 2017. Output producer prices increased by 3.6% in the 12 months to May 2017, the third consecutive month it has been at this rate.
Figure 1 also shows the 12-month growth in the Consumer Prices Index including owner occupiers’ housing costs (CPIH) was 2.7% in May 2017.
Figure 1: Annual growth rate for PPI input (left hand side), PPI output and CPIH (right hand side)
May 2008 to May 2017, UK
Source: Office for National Statistics
Notes:
- These data are also available within the Dashboard: Understanding the UK economy
Download this image Figure 1: Annual growth rate for PPI input (left hand side), PPI output and CPIH (right hand side)
.png (25.1 kB) .xls (27.6 kB)
4. Consumer and producer prices for clothing
Figure 2 shows the index for CPIH clothing and the output Producer Price Index for UK-produced wearing apparel. Both series are indexed to January 2015 equals 100.
Consumer prices for clothing show seasonal variations with prices increasing in spring and autumn and falling back in summer and winter, a pattern that is not seen in producer output prices.
Factory gate prices for UK-produced clothing (output PPI for wearing apparel shown in Figure 2) have grown around 2% since January 2015, with most of the growth occurring during 2016.
Figure 2: CPIH clothing index and output PPI index for wearing apparel
Jan 2015 to May 2017, UK
Source: Office for National Statistics
Notes:
- Clothing is Classification of Individual Consumption According to Purpose (COICOP) group 03.1.
Download this chart Figure 2: CPIH clothing index and output PPI index for wearing apparel
Image .csv .xlsThe contribution to 12-month growth in the overall CPIH from clothing has been relatively high in recent months. To illustrate the relative movements in clothing prices over recent years, Figure 3 shows the clothing component of CPIH from 2015, 2016 and the year-to-date for 2017, indexed to January for each year.
Figure 3: Clothing component of CPIH, re-indexed to January each year
Jan 2015 to May 2017, UK
Source: Office for National Statistics
Download this chart Figure 3: Clothing component of CPIH, re-indexed to January each year
Image .csv .xlsFigure 3 shows that the pattern of seasonal price changes was similar between 2015 and 2016 with prices reaching similar relative points by the end of each year. Although clothing price growth in February and March this year showed a similar pattern to previous years, the increase in clothing prices seen in April this year was considerably stronger than seen in the last 2 years. Growth in clothing prices between April and May this year is more in line with the previous trend in 2015.
This uptick in clothing prices in 2017 compared with previous years may reflect changes in the sterling exchange rate impacting on the cost of imported clothing and the increased output prices for UK-produced clothing seen in Figure 2.
Back to table of contents5. Input producer prices
The following analysis uses data in the latest Input-Output analytical tables (for 2013) to demonstrate the extent to which domestic UK production is exposed to international supply-chains.
Figure 4 shows the proportion of goods and services inputs for each standard industrial classification (SIC) section of the economy that were directly imported by UK firms in 2010 and 2013 as a share of intermediate consumption1. Produced goods2 and information and communications products were the most import-intensive in 2010 with direct imports accounting for 32.2% and 28.0% of total intermediate consumption respectively. By contrast, real estate products involved direct imports worth just 5.5% of total intermediate consumption.
There was an increase in direct imports in the supply chain of produced goods to reach 36.1% of overall intermediate consumption in 2013. “Other services”3 have also seen an increase in the import intensity of their supply chain between 2010 and 2013 with the remaining sectors of the economy remaining much the same or falling slightly in their direct import share of intermediate consumption.
Figure 4: Direct import share of intermediate consumption by standard industrial classification section
2010 and 2013, UK
Source: Office for National Statistics
Notes:
- Data is taken from the domestic use, basic prices, product by product input-output analytical tables for 2010 and 2013.
- Production sector is made up from Standard Industrial Classification 2007: SIC 2007 Section B (mining and quarrying), C (manufacturing), D (electricity, gas, steam and air conditioning supply and E (water supply; sewerage, waste management and remediation activities).
- Other services is made up from SIC 2007 section R (arts, entertainment and recreation), and S (other services).
Download this chart Figure 4: Direct import share of intermediate consumption by standard industrial classification section
Image .csv .xlsFigure 5 uses the more detailed industry and product breakdowns included in the Input-Output analytical tables to calculate the same data presented in Figure 4 for a selection of manufacturing products.
Some of the largest percentage point increases in the import intensity of the supply chain between 2010 and 2013 were seen in the following products:
- motor vehicles, trailers and semi-trailers
- basic pharmaceutical products and pharmaceutical preparations
- basic iron and steel
- coke and refined petroleum products
Figure 5: Direct import share of intermediate consumption for a selection of manufactured products
2010 and 2013, UK
Source: Office for National Statistics
Notes:
- Data is taken from the domestic use, basic prices, product by product input-output analytical tables for 2010 and 2013.
Download this chart Figure 5: Direct import share of intermediate consumption for a selection of manufactured products
Image .csv .xlsOther products that are also more than 50% exposed to imported supply-chain products are textiles, petrochemicals, other chemical products, and other basic metals and casting. In contrast, food producers sourced around 12 to 20% of their supply chain from overseas according to the detailed input-output tables.
Figure 6 shows how the input prices for the production of motor vehicles, trailer and semi-trailers, and preserved meat and meat products relate to the inverted sterling effective exchange rate. These products have been chosen to represent a relatively high import-intensive supply chain and a relatively low import-intensive supply chain respectively.
Figure 6 shows input prices for the production of motor vehicles are more closely related to movements in the effective exchange rate (correlation coefficient of 0.6), compared with input prices for preserved meat products (correlation of 0.1). This relationship may reflect the relative import-intensity of their respective supply chains.
Figure 6: Index of input producer prices for a) motor vehicles, trailers, b) preserved meat and meat products and the inverted sterling effective exchange rate (ERI)
Jan 2010 to May 2017, UK
Source: Office for National Statistics and Bank of England
Download this chart Figure 6: Index of input producer prices for a) motor vehicles, trailers, b) preserved meat and meat products and the inverted sterling effective exchange rate (ERI)
Image .csv .xlsNotes for: Input producer prices
- Intermediate consumption is the total of goods and services that are used in the production of other goods and services in the economy and not consumed by households or government.
- Production sector is made up from SIC 2007 Section B (mining and quarrying), C (manufacturing), D (electricity, gas, steam and air conditioning supply) and E (water supply; sewerage, waste management and remediation activities).
- Other services is made up from Section R (arts, entertainment and recreation), and S (other services).
6. Trends in housing prices and property transactions
Figure 7 shows the long-term trends in volume of property transactions in London and the UK, indexed to January 2005 equals 100.
The trends in property transactions for both series are broadly consistent over time. The unusually high level of transactions in March 2016 was associated with the introduction of the higher tax rates on additional properties introduced from 1 April 2016. This resulted in a large spike in sales transactions during March 2016 followed by lower transaction volumes in April 2016.
Since then, the recovery in transaction volumes has been weaker in London relative to the rest of the UK. The volume of transactions in London in December 2016 was at the same level as seen in January 2005, while it was around 40% higher for the UK as a whole, as shown in Figure 7.
Figure 7: Volumes of property transactions, UK and London
Jan 2005 to Dec 2016
Source: UK House Price Index, Office for National Statistics
Notes:
- Volume of transaction data for recent months are omitted due to incomplete data
Download this chart Figure 7: Volumes of property transactions, UK and London
Image .csv .xlsFigure 8 presents the relationship between the 12-month growth rates in average house price and volume of transactions for the London region. It can be seen that growth in sales leads growth in prices by around 5 months. Sales growth can therefore feed into higher prices if supply is relatively fixed in the short run and the other way round for falls in sales.
Figure 8: London 12- month growth rate in property transactions (right-hand scale) and average house prices (moved forward 5 months) (left-hand scale)
January 2006 to November 2016
Source: Office for National Statistics, Land Registry
Notes:
- Changes in property transactions leads changes in average price by 5 months. A 5 month period is chosen as it has the highest correlation of 0.7.
Download this chart Figure 8: London 12- month growth rate in property transactions (right-hand scale) and average house prices (moved forward 5 months) (left-hand scale)
Image .csv .xlsDuring the economic downturn both house prices and transaction volumes fell sharply. This was followed by relatively strong growth in transaction volumes and increasing house price growth, particularly during 2013 and 2014. This could be caused by high demand for London properties with very little growth in supply. Demand for housing has, for example, been boosted by consistently low interest rates and a falling deposit ratio.
More recently, since the Stamp Duty changes in April 2016, we have seen a general fall in property transactions volumes in London and a slow-down in house price annual growth from around the same period. Average house prices in London increased by 4.7% in the 12 months to April 2017, down from 12.3% in the 12 months to April 2016. This may be influenced by a slowdown in previous transactions, the buy-to-let market and other demand factors.
Back to table of contents