Table of contents
- Main points
- Statistician’s comment
- Summary
- Average wage levels have risen broadly in line with CPIH levels since January 2016, but prices for some components of CPIH have risen more quickly
- Exchange rate movements have more impact on price movements for food than for fuel
- In January 2019, the annual growth rate for UK HPI was below that for both CPIH and AWE for the first time since June 2013
- Authors
1. Main points
The 12-month growth rate of the Consumer Prices Index including owner occupiers’ housing costs (CPIH) was 1.8% in February 2019, unchanged from January 2019.
The input Producer Price Index (input PPI) grew by 3.7% in the 12 months to February 2019, increasing from 2.6% in the 12 months to January 2019.
The output Producer Price Index (output PPI) grew by 2.2% in the 12 months to February 2019, up from 2.1% in the 12 months to January 2019.
Since January 2016, average wages and consumer prices (as measured by the CPIH) have risen broadly in line with each other.
Prices for some components of CPIH, such as transport services and electricity, gas and other fuels, have risen much more quickly than average wages in the period since January 2006.
Food prices within PPI and CPIH have tended to move in a similar way to exchange rate movements since January 2006, although there appears to have been a lag in the feed-through from input PPI to output PPI and CPIH following the 2016 depreciation of sterling.
Price movements for crude oil, coke and refined petroleum products, and fuels and lubricants, are more similar to movements in global prices for crude oil than to exchange rate movements.
In January 2019, the annual growth rate of the UK House Price Index fell to 1.7%, driven largely by trends in London, the South East and East of England; this is the first time since June 2013 that house price growth has been lower than annual growth in both CPIH and average weekly earnings.
2. Statistician’s comment
Commenting on today’s inflation figures, Head of Inflation Mike Hardie said:
“The rate of inflation is stable, with a modest rise in food as well as alcohol and tobacco offset by clothing and footwear prices rising by less than they did a year ago.
“While average UK house prices increased over the year, the rate is down from last month, and is at its lowest in almost six years. London property prices continued to fall, seeing their steepest drop since the end of the financial crisis, with Wales, the East Midlands and the West Midlands driving the overall growth.”
Back to table of contents3. Summary
Figure 1 shows that the 12-month growth rate of the Consumer Prices Index including owner occupiers’ housing costs (CPIH) was 1.8% in February 2019, unchanged from January 2019. The largest downward contributions to change in the 12-month rate came from falls in clothing and footwear, particularly footwear. These downward effects were offset by upward contributions from a variety of categories including recreation and culture, (principally games, toys and hobbies), food and non-alcoholic beverages, and alcohol and tobacco.
The input Producer Price Index (input PPI) grew by 3.7% in the 12 months to February 2019, increasing from 2.6% in the 12 months to January 2019. Fuel made the largest upward contribution to the 12- month growth rate of input PPI for February 2019.
The output Producer Price Index (output PPI) grew by 2.2% in the 12 months to February 2019, up marginally from 2.1% in the 12 months to January 2019. All product groups provided upward contributions to the 12-month growth rate of output PPI in February 2019.
Figure 1: 12-month growth rates for the input Producer Price Index (PPI) and output PPI (left-hand side), and the Consumer Prices Index including owner occupiers' housing costs (CPIH) (right-hand side)
UK, February 2010 to February 2019

Source: Office for National Statistics – Consumer Prices Index including owner occupiers' housing costs and Producer Price Index
Notes:
- These data are also available within the Dashboard: Understanding the UK economy.
Download this image Figure 1: 12-month growth rates for the input Producer Price Index (PPI) and output PPI (left-hand side), and the Consumer Prices Index including owner occupiers' housing costs (CPIH) (right-hand side)
.png (25.8 kB) .xlsx (20.6 kB)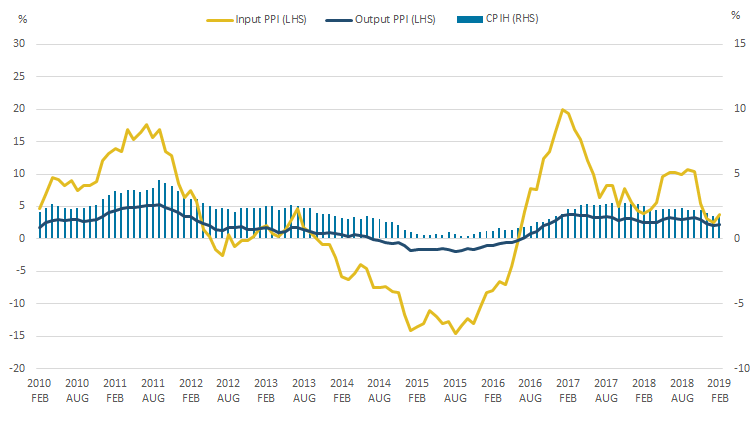
4. Average wage levels have risen broadly in line with CPIH levels since January 2016, but prices for some components of CPIH have risen more quickly
In February 2018, real growth in average weekly earnings turned positive, following a sustained period of negative real terms wage growth from February 2017. Using index series, we can see how wage levels have compared with consumer price levels over the last year since real wage growth turned positive, and over the longer-term.
Figure 2 shows movements in the index series for the Consumer Prices Index including owner occupiers’ housing costs (CPIH) between January 2006 and February 2019, and for regular average weekly earnings (AWE) between January 2006 and January 2019. Both series have been indexed to January 2006 to show their movements over the period.
Average weekly earnings (AWE) data are for Great Britain and measure the amount of money paid to each worker per job per week, excluding benefits-in-kind, unearned income and arrears of pay. Earnings from people who are self-employed are excluded from the AWE estimates. The estimates are calculated before tax and other deductions, and are seasonally adjusted. Regular pay excludes earnings from bonuses.
Figure 2: Price indices for the Consumer Prices Index including owner occupiers' housing costs and nominal regular average weekly earnings (AWE)
January 2006 to February 2019
Source: Office for National Statistics – Consumer Prices Index including owner occupiers' housing costs and Monthly Wages and Salaries Survey
Notes:
- This measure of AWE is seasonally adjusted and the latest data available are for January 2019.
Download this chart Figure 2: Price indices for the Consumer Prices Index including owner occupiers' housing costs and nominal regular average weekly earnings (AWE)
Image .csv .xlsIn the period between January 2006 and January 2019, average wages increased by around 35%, compared with an increase in the consumer price level of around 33% over the same period. In February 2019, the consumer price level ticked up slightly to an overall increase of around 33.5% since January 2006.
For much of the period since January 2016, the indices of regular wages and consumer prices have been at a similar level (relative to their January 2006 levels). This follows a period between March 2011 and December 2015 where the relative consumer price level was consistently above the relative average wage level, likely putting pressure on consumers’ spending power. By contrast, between September 2006 and February 2011, regular wages were at a higher level than consumer prices, relative to their January 2006 levels.
The overall level of consumer price inflation is measured using a weighted basket of goods and services reflecting overall national spending patterns. Figure 3 compares movements in regular average weekly earnings to price movements for a number of components of CPIH, including common household expenses. Data are indexed to January 2006 to show overall price movements across the period.
Figure 3: Price movements for selected components of the Consumer Prices Index including owner occupiers’ housing costs (CPIH) and in nominal regular average weekly earnings (AWE)
January 2006 to February 2019
Source: Office for National Statistics – Consumer Prices Index including owner occupiers' housing costs and Monthly Wages and Salaries Survey
Notes:
- This measure of AWE is seasonally adjusted and the latest data available are for January 2019.
Download this chart Figure 3: Price movements for selected components of the Consumer Prices Index including owner occupiers’ housing costs (CPIH) and in nominal regular average weekly earnings (AWE)
Image .csv .xlsTransport services, one of the more volatile components of CPIH, have seen the largest overall increase in prices in the period since January 2006, with prices at their peak in August 2018 being 132% above their January 2006 level, and being 110% higher than their January 2006 level in February 2019. This was followed closely by prices for electricity, gas and other fuels, which peaked in October 2018 at 118% above their January 2006 level before falling back to 104% above their January 2006 level in February 2019.
In January 2019, price levels for fuels and lubricants and for food were both broadly in line with regular wages, relative to their January 2006 levels, but both also saw a sustained period with relative price levels higher than relative wage levels between 2010 and 2015. Actual rents for housing have moved broadly in line with regular wages throughout the period.
Back to table of contents5. Exchange rate movements have more impact on price movements for food than for fuel
Alongside domestic factors, exchange rate movements can have a considerable impact on price movements. Figures 4 and 5 compare movements in the inverted sterling effective exchange rate to a number of components of the input Producer Price Index (PPI), the output PPI and the Consumer Prices Index including owner occupiers’ housing costs (CPIH).
A rise in the inverted effective exchange rate equates to a fall in the value of sterling, which, all else being equal, would be expected to increase the cost of imports, with a fall in the inverted effective exchange rate having the opposite effect.
Figure 4 shows movements in the 12-month growth rate of prices for the imported food component of input PPI, the food products component of output PPI and the food component of CPIH, as well as for the inverted sterling effective exchange rate.
Figure 4: 12-month growth rates for imported food (input PPI), food products (output PPI), food (CPIH) and the inverted sterling effective exchange rate
UK, January 2006 to February 2019
Source: Office for National Statistics – Producer Price Index, Consumer Prices Index including owner occupiers' housing costs, Bank of England
Download this chart Figure 4: 12-month growth rates for imported food (input PPI), food products (output PPI), food (CPIH) and the inverted sterling effective exchange rate
Image .csv .xls12-month growth rates for all three components have tended to move broadly in line with movements in the effective exchange rate over the period, with the imported food component of input PPI often moving most closely in line with the exchange rate. This is likely to be partly a composition effect, as the input PPI component is exclusively imported food, whereas the food products component of output PPI and the food component of CPIH also use domestically-produced food products. Similarly, other factors such as processing costs and retailer pricing strategies are likely to have a greater influence on output PPI and CPIH than they do on input PPI.
12-month growth rates for the inverted sterling effective exchange rate and the imported food component of input PPI both rose sharply between November 2015 and August 2016, while 12-month growth rates for the food products component of output PPI and the food component of CPIH rose more slowly between September 2016 and July 2017. This may reflect a delayed feed-through effect following the sudden exchange rate movement, with contracts for food producers and retailers taking time to be adjusted in the period following the exchange rate movement. This lag was not apparent, however, when exchange rates moved suddenly in July 2007 to January 2009.
Figure 5 shows movements in the 12-month growth rates of prices for the crude oil component of input PPI, the coke and refined petroleum products component of output PPI and the fuels and lubricants component of CPIH, as well as for the inverted sterling effective exchange rate and the World Bank price for crude oil. The vertical scale for Figure 5 is different to that of Figure 4, reflecting the respective degrees of volatility in the imported food and crude oil components of input PPI.
Figure 5: 12-month growth rates for crude oil (input PPI), coke and refined petroleum products (output PPI), fuels and lubricants (CPIH), inverted sterling effective exchange rate and World Bank prices for crude oil
UK, January 2006 to February 2019
Source: Office for National Statistics – Producer Price Index, Consumer Prices Index including owner occupiers' housing costs, Bank of England, World Bank
Download this chart Figure 5: 12-month growth rates for crude oil (input PPI), coke and refined petroleum products (output PPI), fuels and lubricants (CPIH), inverted sterling effective exchange rate and World Bank prices for crude oil
Image .csv .xls12-month growth rates for the crude oil component of input PPI, the coke and refined petroleum products component of output PPI and the fuels and lubricants component of CPIH have moved broadly in line with one another over the period, although price movements are considerably larger for input PPI than output PPI and CPIH.
Exchange rate movements tend to have relatively limited impact on price movements for the crude oil component of input PPI, as the large movements in global prices for crude oil are generally the biggest driver of movements for the crude oil component of input PPI. At times, however, a gap emerges between growth in global prices for crude oil and growth in the crude oil component of input PPI, which is likely to be an exchange rate effect as crude oil is priced in US dollars and so movements in the exchange rate between US dollars and sterling feed through in their entirety. The depreciation of sterling in 2016 contributed to the increasing growth rate for the crude oil component of input PPI at the time, but had much less impact than the sharp increase in the growth rate of global prices for crude oil.
Back to table of contents6. In January 2019, the annual growth rate for UK HPI was below that for both CPIH and AWE for the first time since June 2013
Figure 6 shows movements in the 12-month growth rates for the House Price Index (HPI) from January 2010 to January 2019 and for the Consumer Prices Index including owner occupiers’ housing costs (CPIH) and nominal regular average weekly earnings (AWE) from January 2010 to February 2019.
Average weekly earnings (AWE) data are for Great Britain and measure the amount of money paid to each worker per job per week, excluding benefits-in-kind, unearned income and arrears of pay. Earnings from people who are self-employed are excluded from the AWE estimates. The estimates are calculated before tax and other deductions, and are seasonally adjusted. Regular pay excludes earnings from bonuses.
Annual growth in the UK HPI has followed a broadly downward trend since 2014, with the growth rate falling fairly consistently from 2016. In January 2019, the annual growth rate for UK HPI was 1.7%, with CPIH and AWE growing by 1.8% and 3.5%, respectively. This is the first time since January 2013 that annual growth in HPI has been below both CPIH and AWE growth, with house prices previously growing more slowly than consumer prices and average wages between November 2010 and January 2013.
Figure 6: 12-month growth rate in the UK House Price Index (HPI), Consumer Prices Index including owner occupiers' housing costs (CPIH) and nominal regular average weekly earnings (AWE)
UK, January 2010 to February 2019
Source: Office for National Statistics – UK House Price Index and Monthly Wages and Salaries Survey, HM Land Registry
Notes:
- This measure of AWE is seasonally adjusted. The latest data available for AWE and HPI are for January 2019.
Download this chart Figure 6: 12-month growth rate in the UK House Price Index (HPI), Consumer Prices Index including owner occupiers' housing costs (CPIH) and nominal regular average weekly earnings (AWE)
Image .csv .xlsRecent falls in house price growth have been driven largely by trends in London and surrounding regions in the South and East of England. Figure 7 shows movements in the 12-month growth rate of the House Price Index for selected regions and countries of the UK from January 2014 to January 2019.
Figure 7: 12-month growth rate in house prices for selected regions and countries of the UK
UK, January 2014 to January 2019
Source: Office for National Statistics – UK House Price Index, HM Land Registry
Notes:
- Northern Ireland data are only available on a quarterly basis. Northern Ireland data are copied forward until the next quarter’s data are available, which will be on 22 May 2019
Download this chart Figure 7: 12-month growth rate in house prices for selected regions and countries of the UK
Image .csv .xlsHouse price growth in London has fallen sharply over the period from a high point of 20.6% in August 2014 to a low of negative 1.6% in January 2019, the lowest annual house price growth London has seen since September 2009, in the wake of the financial crisis. Annual house price growth in the East of England has also turned negative in January 2019, the first time prices have fallen over the year since October 2011. House price growth in the South East remains positive but at a very low rate of 0.1% in January 2019, its lowest rate since November 2011.
House price growth in Wales and Northern Ireland has been relatively stable over the period, with both having annual growth rates of around 5.0% in recent months. House price growth in Scotland has been somewhat more volatile and has seen consistent falls in the annual growth rate since September 2018, reaching a recent low of 1.3% growth in January 2019.
Back to table of contents