
1. Main points
Net investment of £1 billion was reported by insurance companies, pension funds and trusts in Quarter 1 (Jan to Mar) 2018; in terms of context, the five-year quarterly average for this series is net investment of £9 billion.
The net disinvestment by long-term insurance companies in Quarter 1 2018 (£17 billion) was the largest since the start of this series in 1963 and these businesses also reported a record level of claims (£65 billion) in the first quarter of 2018.
In Quarter 1 2018, the disinvestment of £5 billion in overseas government securities was the largest since the start of this series in 1986.
In 2017, the provisional annual estimate of net investment by insurance companies, pension funds and trusts (£92 billion) was the largest since the start of this series in 1987; this was caused mainly by net investment in other assets (mainly mutual funds) at £42 billion, short-term assets at £32 billion and gilts at £29 billion.
In 2017, the provisional annual estimate of net investment by self-administered pension funds (£39 billion) was the largest since the start of this series in 1964. This was caused mainly by net investment in gilts of £32 billion.
2. Things you need to know about this release
This publication considers the investment choices of insurance companies, self-administered pension funds, investment trusts, unit trusts and property unit trusts. Before viewing the MQ5 publication, it is recommended that readers familiarise themselves with the institutional groups covered within.
These institutions control £4 trillion of assets and engage in considerable volumes of investment activity to fund their operations. An understanding of their investments and assets is important to monitor the stability of the financial sector and is used in the compilation of the UK National Accounts.
The MQ5 release includes quarterly net investment data arising from financial transactions (investments) made by these institutions. Also included are quarterly balance sheet data for short-term assets and liabilities, plus quarterly income and expenditure data for insurance companies and self-administered pension funds. All data are reported at current prices (effects of price changes included).
We make every effort to provide informative commentary on the data in this release. As part of the quality assurance process, individual businesses are contacted in an attempt to capture reasons for extreme period-on-period data movements. It can prove difficult to elicit detailed reasons from some businesses to help inform the commentary. Frequently, reasons given for data movements refer to a “change in investment strategy” or a “fund manager’s decision”. Consequently, it is not possible for all data movements to be fully explained.
Data for Quarter 1 (Jan to Mar) 2017 onwards remain provisional and subject to revision until the incorporation of the 2017 annual survey results in December 2018 (see section 8 Revisions).
It is sometimes necessary to suppress figures for certain items to avoid disclosing investment activity by individual institutions. In these cases, the figures are usually combined with those for another item and this will be indicated in the tables by means of a footnote.
All estimates are reported on a current price basis (that is, they are not adjusted to remove the effects of inflation).
A Glossary is available to assist your understanding of the terms used in this release.
Back to table of contents3. Net investment by asset type
Provisional estimates for 2017 show that these businesses acquired £1,880 billion and disposed of £1,785 billion longer-term financial instruments. Net investment is the difference between acquisitions and disposals of longer-term assets, as well as changes in holdings of short-term assets, and can therefore be volatile. Table 1 (at the end of this section) displays net investment data by asset type.
Quarter 1 (Jan to Mar) 2018 was the fifth consecutive quarter of net investment (£1 billion (Figure 1)). In terms of context, the five-year quarterly average for this series is net investment of £9 billion. Net investment was reported in short-term assets, other assets and UK government sterling securities.
Figure 1: Total net investment
UK, Quarter 1 (Jan to Mar) 2012 to Quarter 1 2018
Source: Office for National Statistics
Download this chart Figure 1: Total net investment
Image .csv .xlsFor 2017 net investment reported by the institutions covered in this release is provisionally estimated at £92 billion, the highest since the start of this series in 1987.
Net investment or net disinvestment varies across the quarters of a calendar year and so an increase or decrease in investment from one quarter to the next is not necessarily an indicator of improved or worsened economic activity. A better gauge of investor activity is the composition of investment between types of instruments over a number of quarters, which is more likely to reflect varying investment strategies.
Short-term assets
Investment in short-term assets (those maturing within one year of their originating date) can be affected by the level of the net inflows of funds into the businesses concerned (premiums or contributions, for example) and by the relative attractiveness of other investments, both in terms of their potential returns and risk.
In Quarter 1 2018, there was net investment of £16 billion in short-term assets (Figure 2), the largest for this series since Quarter 1 2013 (£17 billion). In terms of context, the five-year quarterly average for this series is net investment of £3 billion.
Figure 2: Net investment in short-term assets
UK, Quarter 1 (Jan to Mar) 2012 to Quarter 1 2018
Source: Office for National Statistics
Download this chart Figure 2: Net investment in short-term assets
Image .csv .xlsThe provisional annual estimate of net investment of £32 billion in short-term assets in 2017 was the largest since 2007 (£41 billion). This may reflect a change in the outlook of the surveyed institutional groups with businesses choosing to favour liquidity at this time. Short-term assets are particularly attractive during periods of uncertainty, as they allow businesses to change their investment strategies as events unfold.
UK government sterling securities (gilts)
UK gilts (gilt-edged market securities) are fixed income or index-linked bonds issued by the UK government. On the primary gilt market, the purchaser of a gilt lends the government money in return for regular interest payments and the promise that the nominal value of the gilt will be repaid (redeemed) on a specified future date. These assets may then be bought and sold by investors in the secondary market. Gilts are very liquid assets that offer virtually risk-free returns.
The institutions covered by this release reported net investment in gilts in Quarter 1 2018 of £4 billion (Figure 3), the ninth consecutive quarter of net investment in these assets. In terms of context, the five-year quarterly average for this series is net investment of £5 billion.
Figure 3: Net investment in UK government sterling securities (gilts)
UK, Quarter 1 (Jan to Mar) 2012 to Quarter 1 2018
Source: Office for National Statistics
Download this chart Figure 3: Net investment in UK government sterling securities (gilts)
Image .csv .xlsLooking at the annual picture, the 2017 provisional estimate of net investment of £29 billion in gilts was the fifth consecutive year of net investment. This was preceded by net disinvestment in 2011 and 2012, which may suggest that some market participants (particularly pension funds) have been switching back to gilts in recent years. This is possibly due to the relative attractiveness of gilts as low-risk compared with other asset types.
In recent times, the market for gilts has been notably influenced by the Bank of England's quantitative easing programme. On 4 August 2016, the Monetary Policy Committee voted to extend the programme of quantitative easing to £435 billion and to make up to £10 billion of corporate bond purchases over an 18-month period. The gilt portion of this extension ended in January 2017 and it reinvested funds from maturing assets in February and September of 2017. Generally, the additional demand for gilts from the Central Bank would likely result in net disinvestment by other institutions, notwithstanding issues of new gilts. These effects are not immediately apparent in the overall net investment data for this asset type.
UK gilts can be an attractive investment option because they are very secure, reflecting the fact that the British government has never failed to make an interest or principal payment when they are due. The demand for government bonds can increase in periods of economic uncertainty and geopolitical risk, with the popularity of this investment leading to an increase in the price of gilts and a fall in their yields.
The demand for gilts can also be driven by market expectations. For example, if the market anticipates that the central bank is going to announce expansionary monetary policy measures like quantitative easing, demand for these assets can grow, leading to an increase in the price of bonds and a fall in their yield. If you are interested in additional information about gilts that is not already covered in this release, please visit the UK Debt Management Office or Bank of England. In the event of future interest rate rises, then we may see a decrease in the price and a rise in the yield of gilts.
UK corporate securities and overseas securities
These asset categories comprise ordinary shares, corporate bonds and preference shares. In addition, non-UK government securities are included as part of overseas securities.
The 2017 provisional annual estimates suggest that businesses preferred to invest in fixed-income instruments (such as corporate bonds and government bonds) compared with ordinary shares. This was particularly evident in overseas securities and also in UK corporate securities and may indicate that these businesses saw fixed-income investments to be a relatively attractive and stable investment option, when compared with ordinary shares, during 2017. Stock markets were generally at a high level during 2017 and as share prices have risen, investors may have elected to diversify by increasing their bond exposure.
UK corporate securities
In Quarter 1 2018 there was net disinvestment of £10 billion in UK corporate securities (Figure 4). This was caused mainly by net disinvestment of £11 billion in UK ordinary shares.
In terms of context, the five-year quarterly average for UK corporate securities is net disinvestment of £5 billion.
Figure 4: Net investment in UK corporate securities
UK, Quarter 1 (Jan to Mar) 2012 to Quarter 1 2018
Source: Office for National Statistics
Download this chart Figure 4: Net investment in UK corporate securities
Image .csv .xlsThe 2017 provisional annual estimate of net investment in other UK corporate securities (mainly corporate bonds) of £5 billion was the largest for this series since 2013 (£5 billion). This contrasts with a provisional estimate of net disinvestment in 2017 of £29 billion in UK ordinary shares, the largest for this series since 2011 (£32 billion).
Overseas securities
In Quarter 1 2018, there was net disinvestment of £13 billion (Figure 5) in overseas securities. This was caused by net disinvestment of £12 billion in overseas ordinary shares and net disinvestment of £5 billion in overseas government securities, the largest since the start of this series in 1986.
In terms of context, the five-year quarterly average for overseas securities is net investment of £1 billion.
Figure 5: Net investment in overseas securities
UK, Quarter 1 (Jan to Mar) 2012 to Quarter 1 2018
Source: Office for National Statistics
Download this chart Figure 5: Net investment in overseas securities
Image .csv .xlsThe 2017 provisional annual estimate of net investment in overseas securities (£13 billion) follows net disinvestment of £32 billion in 2016. This turnaround was caused mainly by net investment in overseas government securities of £16 billion, the highest level of net investment for this series since records began in 1986 and net investment in other overseas corporate securities (mainly corporate bonds) of £15 billion, the largest since 2012 (£21 billion). Both of these net investments have been offset in part by net disinvestment in overseas ordinary shares (£19 billion).
Other assets
The category “other assets” covers UK and overseas investment in:
- mutual fund investments
- insurance-managed funds
- UK government securities denominated in foreign currency
- local authority and public corporation securities
- loans
- fixed assets
- insurance policies and annuities
- direct investment
- other assets not elsewhere classified
In Quarter 1 2018, there was net investment of £4 billion (Figure 6) in other assets. In terms of context, the five-year quarterly average for this series is net investment of £6 billion.
Figure 6: Net investment in other assets
UK, Quarter 1 (Jan to Mar) 2012 to Quarter 1 2018
Source: Office for National Statistics
Download this chart Figure 6: Net investment in other assets
Image .csv .xlsThe 2017 provisional annual estimate of net investment in other assets (£42 billion) was the largest since the start of this time series in 1987. This was caused mainly by net investment by long-term insurance in mutual funds.
Table 1: Net investment by asset type UK, Quarter 1 (Jan to Mar) 2012 to Quarter 1 2018
| £ billion | ||||||
| Total | Short-term assets | UK government sterling securities | UK corporate securities | Overseas securities | Other assets | |
|---|---|---|---|---|---|---|
| 2012 | 55.6 | 15.0 | -10.2 | -10.0 | 46.5 | 14.3 |
| 2013 | 48.4 | 24.9 | 12.6 | -20.4 | 18.1 | 13.3 |
| 2014 | 12.5 | 5.9 | 10.2 | -22.6 | -0.7 | 19.8 |
| 2015 | 27.6 | 4.5 | 0.8 | -20.6 | 18.8 | 24.1 |
| 2016 | -5.7 | -8.5 | 37.8 | -17.3 | -31.9 | 14.2 |
| 2017 | 92.1 | 32.2 | 28.6 | -24.1 | 13.1 | 42.4 |
| Q1 2012 | 17.1 | 10.7 | -7.6 | -4.4 | 13.9 | 4.5 |
| Q2 2012 | 8.4 | -0.3 | -1.9 | -2.3 | 9.7 | 3.2 |
| Q3 2012 | 18.3 | 3.0 | -2.0 | 1.6 | 13.0 | 2.7 |
| Q4 2012 | 11.8 | 1.6 | 1.3 | -4.8 | 9.9 | 3.9 |
| Q1 2013 | 5.4 | 16.5 | 0.6 | -6.6 | -6.3 | 1.2 |
| Q2 2013 | 21.1 | 2.8 | 7.1 | -1.6 | 9.6 | 3.2 |
| Q3 2013 | 15.2 | 7.3 | 3.1 | -9.3 | 9.4 | 4.7 |
| Q4 2013 | 6.7 | -1.7 | 1.9 | -3.0 | 5.3 | 4.1 |
| Q1 2014 | 18.8 | 6.6 | 6.6 | -6.6 | 6.0 | 6.3 |
| Q2 2014 | 3.8 | 1.9 | 6.2 | -2.9 | -4.6 | 3.2 |
| Q3 2014 | 9.8 | 6.7 | 3.2 | -3.6 | -1.1 | 4.5 |
| Q4 2014 | -19.8 | -9.3 | -5.7 | -9.5 | -1.1 | 5.8 |
| Q1 2015 | 6.4 | 12.6 | -3.2 | -8.8 | 3.0 | 2.7 |
| Q2 2015 | 6.1 | -10.9 | 3.9 | -9.6 | 4.7 | 18.0 |
| Q3 2015 | 14.5 | -1.4 | 1.0 | 1.8 | 9.9 | 3.2 |
| Q4 2015 | 0.6 | 4.1 | -0.9 | -4.0 | 1.2 | 0.1 |
| Q1 2016 | -17.9 | -17.2 | 0.6 | -7.6 | -3.5 | 9.9 |
| Q2 2016 | 19.3 | 11.1 | 18.3 | -0.8 | -12.4 | 3.0 |
| Q3 2016 | 5.2 | 7.4 | 6.4 | -4.4 | -7.5 | 3.2 |
| Q4 2016 | -12.2 | -9.8 | 12.5 | -4.6 | -8.5 | -1.8 |
| Q1 2017 | 12.4 | 11.1 | 4.9 | -14.5 | -3.5 | 14.4 |
| Q2 2017 | 35.3 | 5.4 | 11.7 | -3.6 | 14.4 | 7.5 |
| Q3 2017 | 23.6 | 2.2 | 10.6 | 2.0 | 4.2 | 4.7 |
| Q4 2017 | 20.7 | 13.5 | 1.5 | -8.0 | -2.0 | 15.7 |
| Q1 2018 | 1.3 | 16.1 | 4.0 | -10.0 | -13.3 | 4.5 |
| Source: Office for National Statistics | ||||||
| Notes: | ||||||
| 1. Components may not sum to totals due to rounding. | ||||||
| 2. Data for Quarter 1 2017 onwards remain provisional and subject to revision until the incorporation of the 2017 annual survey results in December 2018. | ||||||
| 3. Q1 is Quarter 1 (January to March), Q2 is Quarter 2 (April to June), Q3 is Quarter 3 (July to September) and Q4 is Quarter 4 (October to December). | ||||||
Download this table Table 1: Net investment by asset type UK, Quarter 1 (Jan to Mar) 2012 to Quarter 1 2018
.xls (37.4 kB)4. Net investment by institutional group
Net investment data for each of the institutional groups covered by this release are displayed in Table 2 (at the end of this section).
Long-term insurance companies
These are companies that provide either protection in the form of life assurance or critical illness policies, or investment in the form of pension provision.
Long-term insurance companies showed net disinvestment of £17 billion in Quarter 1 (Jan to Mar) 2018 (Figure 7). This was the largest net disinvestment since the start of this series in 1963 and was caused mainly by net disinvestment in overseas ordinary shares (£12 billion) and UK ordinary shares (£10 billion). These businesses also reported a record level of claims in Quarter 1 2018. Some of the increase in the level of claims may be attributable to insurance and pension industry changes (see section 5 Income and Expenditure).
In terms of context, the five-year quarterly average for this series is net disinvestment of £2 billion.
Figure 7: Net investment by long-term insurance companies
UK, Quarter 1 (Jan to Mar) 2012 to Quarter 1 2018
Source: Office for National Statistics
Download this chart Figure 7: Net investment by long-term insurance companies
Image .csv .xlsThe 2017 provisional annual estimate of net disinvestment by these businesses in overseas ordinary shares (£15 billion) was the largest since records began in 1963. The net disinvestment in UK ordinary shares (£19 billion) was the largest since 2012 (£24 billion). This net disinvestment in shares contrasts with the 2017 provisional estimate of net investment in mutual funds (£42 billion), which was the largest since the start of this time series in 2000. This may indicate that these businesses adopted a strategy of passive investment during this period. Passive investment is a strategy whereby asset holders invest in funds that hold a basket of assets to represent the asset group. This ensures that returns to the investor are the same as the returns of that asset group, but costs are reduced as analysis of each constituent of the group is not required.
General insurance companies
These are companies that undertake other types of insurance such as motor, home and travel. This type of insurance is usually over a shorter period, most commonly 12 months.
General insurance companies showed net investment in Quarter 1 2018 of £0.5 billion. (Figure 8) The five-year quarterly average for this series is net disinvestment of £0.4 billion.
Figure 8: Net investment by general insurance companies
UK, Quarter 1 (Jan to Mar) 2012 to Quarter 1 2018
Source: Office for National Statistics
Download this chart Figure 8: Net investment by general insurance companies
Image .csv .xlsSelf-administered pension funds
These are funds established by pension scheme trustees to facilitate and organise the investment of employees’ retirement funds.
Self-administered pension funds reported net investment in Quarter 1 2018 of £3 billion (Figure 9). In terms of context, the five-year quarterly average for this series is net investment of £5 billion.
Figure 9: Net investment by self-administered pension funds
UK, Quarter 1 (Jan to Mar) 2012 to Quarter 1 2018
Source: Office for National Statistics
Download this chart Figure 9: Net investment by self-administered pension funds
Image .csv .xlsIn 2017, the provisional annual estimate of net investment by self-administered pension funds (£39 billion) was the largest since the start of this series in 1964. This was caused mainly by net investment in gilts of £32 billion.
By contrast, the 2017 provisional estimate of net disinvestment (£20 billion) by these businesses in overseas ordinary shares was the largest since the start of this series in 1963, following net disinvestment of £12 billion in 2016.This, along with the increased move towards gilts, may indicate that these businesses were pursuing a relatively liquid investment portfolio in recent years.
Investment trusts
Investment trusts acquire financial assets with money subscribed by shareholders or borrowed in the form of loan capital. Investment trusts are not trusts in the legal sense, but are limited companies with two special characteristics: their assets consist of securities and they are debarred by their articles of association from distributing capital gains as dividends. Shares of investment trusts are traded on the London Stock Exchange and increasingly can be bought direct from the company.
In Quarter 1 2018, investment trusts reported net investment of £0.3 billion, broadly in keeping with the five-year quarterly average for this series.
Unit trusts and property unit trusts
Unit trusts include open-ended investment companies (OEICs) but do not cover other unitised collective investment schemes or those based offshore. They are set up under trust deeds, the trustee usually being a bank or insurance company. The funds in the trusts are managed not by the trustees, but by independent management companies. Units representing a share in the trusts’ assets can be bought from the managers or resold to them at any time.
Property unit trusts invest predominantly in freehold or leasehold commercial property yet may hold a small proportion of their investments in the securities of property companies.
In Quarter 1 2018, unit trusts and property unit trusts reported net investment of £14 billion (Figure 10). The five-year quarterly average for this series is net investment of £10 billion.
Figure 10: Net investment by unit trusts and property unit trusts
UK, Quarter 1 (Jan to Mar) 2012 to Quarter 1 2018
Source: Office for National Statistics
Download this chart Figure 10: Net investment by unit trusts and property unit trusts
Image .csv .xlsIn 2017, the provisional annual estimate of net investment by unit trusts and property unit trusts (£81 billion) was the largest since the start of this series in 1984. This was caused mainly by net investment in overseas securities and short-term assets, with both being record figures. The net investment in overseas securities of £40 billion was the largest since the start of this series in 1986. The net investment in short-term assets (£18 billion) was the largest since the start of this series in 1980.
Table 2: Net investment by institutional group UK, Quarter 1 (Jan to Mar) 2012 to Quarter 1 2018
| £ billion | ||||||||||||||||
| Total | Long-term insurance companies | General insurance companies | Self-administered pension funds | Investment trusts | Unit trusts and property unit trusts | Consolidation adjustment1 | ||||||||||
|---|---|---|---|---|---|---|---|---|---|---|---|---|---|---|---|---|
| 2012 | 55.6 | 3.7 | 1.6 | 19.7 | -0.2 | 53.5 | -22.6 | |||||||||
| 2013 | 48.4 | -17.3 | 0.8 | 18.8 | 0.6 | 50.9 | -5.4 | |||||||||
| 2014 | 12.5 | -14.6 | -10.0 | 10.3 | 0.8 | 48.7 | -22.7 | |||||||||
| 2015 | 27.6 | -5.0 | 4.6 | 13.6 | 0.2 | 30.5 | -16.3 | |||||||||
| 2016 | -5.7 | 3.9 | -6.3 | 20.4 | 1.4 | -2.8 | -22.3 | |||||||||
| 2017 | 92.1 | 11.1 | 0.7 | 38.7 | -3.8 | 80.8 | -35.4 | |||||||||
| Q1 2012 | 17.1 | 2.3 | 1.7 | 4.9 | 0.1 | 11.1 | -3.0 | |||||||||
| Q2 2012 | 8.4 | 2.1 | -1.3 | -3.4 | 0.1 | 9.4 | 1.6 | |||||||||
| Q3 2012 | 18.3 | -2.4 | 0.4 | 9.8 | -0.4 | 15.0 | -4.0 | |||||||||
| Q4 2012 | 11.8 | 1.8 | 0.8 | 8.4 | 0.1 | 18.0 | -17.2 | |||||||||
| Q1 2013 | 5.4 | -1.4 | -1.4 | -4.0 | 0.5 | 17.1 | -5.5 | |||||||||
| Q2 2013 | 21.1 | -0.4 | 1.3 | 6.5 | -0.2 | 14.8 | -1.0 | |||||||||
| Q3 2013 | 15.2 | -4.7 | 0.7 | 10.5 | 0.1 | 6.7 | 1.9 | |||||||||
| Q4 2013 | 6.7 | -10.8 | 0.2 | 5.8 | 0.1 | 12.3 | -0.8 | |||||||||
| Q1 2014 | 18.8 | -0.3 | 1.1 | 9.7 | 0.1 | 16.8 | -8.6 | |||||||||
| Q2 2014 | 3.8 | -5.9 | -4.0 | 9.2 | 0.3 | 11.5 | -7.3 | |||||||||
| Q3 2014 | 9.8 | -1.0 | -1.5 | -0.1 | 0.4 | 16.4 | -4.4 | |||||||||
| Q4 2014 | -19.8 | -7.4 | -5.6 | -8.4 | 0.0 | 4.0 | -2.4 | |||||||||
| Q1 2015 | 6.4 | -3.4 | -0.6 | 6.9 | -0.9 | 5.5 | -1.1 | |||||||||
| Q2 2015 | 6.1 | -2.2 | 2.0 | 6.7 | 0.8 | 3.0 | -4.1 | |||||||||
| Q3 2015 | 14.5 | 2.6 | 2.0 | 1.1 | 0.2 | 12.8 | -4.3 | |||||||||
| Q4 2015 | 0.6 | -1.9 | 1.2 | -1.1 | 0.1 | 9.2 | -6.8 | |||||||||
| Q1 2016 | -17.9 | -8.2 | -5.8 | 8.1 | 0.5 | -4.8 | -7.7 | |||||||||
| Q2 2016 | 19.3 | 0.1 | 1.0 | 16.8 | 1.1 | 6.9 | -6.6 | |||||||||
| Q3 2016 | 5.2 | 9.9 | 0.6 | 3.5 | -0.7 | -4.0 | -4.2 | |||||||||
| Q4 2016 | -12.2 | 2.2 | -2.2 | -8.0 | 0.5 | -0.9 | -3.8 | |||||||||
| Q1 2017 | 12.4 | 5.1 | -2.3 | 7.0 | -2.0 | 14.8 | -10.2 | |||||||||
| Q2 2017 | 35.3 | 1.8 | 1.0 | 17.5 | -1.0 | 24.3 | -8.2 | |||||||||
| Q3 2017 | 23.6 | 0.4 | 1.7 | 7.4 | -0.5 | 22.3 | -7.8 | |||||||||
| Q4 2017 | 20.7 | 3.9 | 0.2 | 6.8 | -0.3 | 19.5 | -9.3 | |||||||||
| Q1 2018 | 1.3 | -16.9 | 0.5 | 3.2 | 0.3 | 14.1 | 0.1 | |||||||||
| Source: Office for National Statistics | ||||||||||||||||
| Notes: | ||||||||||||||||
| 1. The consolidation adjustment is an adjustment to remove inter-sectoral flows between the different types of institution covered. The adjustment includes (i) investment in authorised unit trust units, open-ended investment companies and investment trust securities by insurance companies, pension funds and trusts and (ii) investment by pension funds in insurance managed funds and property unit trust units. | ||||||||||||||||
| 2. Components may not sum to totals due to rounding. | ||||||||||||||||
| 3. Data for Quarter 1 2017 onwards remain provisional and subject to revision until the incorporation of the 2017 annual survey results in December 2018. | ||||||||||||||||
| 4. Q1 is Quarter 1 (January to March), Q2 is Quarter 2 (April to June), Q3 is Quarter 3 (July to September) and Q4 is Quarter 4 (October to December). | ||||||||||||||||
Download this table Table 2: Net investment by institutional group UK, Quarter 1 (Jan to Mar) 2012 to Quarter 1 2018
.xls (38.4 kB)5. Income and expenditure by institutional group
Rather than provide analysis on total income and expenditure for the institutional groups, it is considered more beneficial to users, based on their feedback, if commentary is concentrated on particular components. For insurance companies, the focus is on premiums and claims, while contributions (net of refunds) and payments are the focus for self-administered pension funds (see Table 3, at the end of this section).
Long-term insurance companies
In Quarter 1 (Jan to Mar) 2018, the value of claims was £65 billion. This was the largest level of claims since the start of this series in 2003.
This was caused mainly by occupational pension claims (which includes insurance companies who manage occupational pension funds) with claims of £41 billion. This is almost double the five-year quarterly average for claims arising from occupational pension business (£21 billion). This unusually high level of claims in Quarter 1 2018 is likely to have impacted upon the record level of net disinvestment (£17 billion) reported by long-term insurance companies this quarter.
These businesses may have been disinvesting to meet the demand of increased claims. There have been some notable regulatory changes to the long-term insurance sector in recent years that may be influencing this activity (for example Solvency ll and MiFID II). It may also be possible that some of the increase in the level of disinvestment and claims may be attributable to pensions industry changes relating to the pooling of local authority funds. However, the impact of this long-term insurance activity is not yet apparent in the MQ5 pensions data.
The value of long-term insurance premiums in Quarter 1 2018 was £41 billion. The five-year quarterly average for this series is £33 billion. The value of claims exceeded the value of premiums in each of the years since 2008, reversing the trend of premiums exceeding the value of claims, evident between 2003 (when records for these series began) and 2007.
Figure 11: Long-term insurance companies’ premiums and claims
UK, Quarter 1 (Jan to Mar) 2012 to Quarter 1 2018
Source: Office for National Statistics
Download this chart Figure 11: Long-term insurance companies’ premiums and claims
Image .csv .xlsGeneral insurance companies
In Quarter 1 2018, the value of premiums was £9 billion, in keeping with the five-year quarterly average for this series.
In Quarter 1 2018, the value of claims was £6 billion, in line with the five-year quarterly average for this series.
Figure 12: General insurance companies’ premiums and claims
UK, Quarter 1 (Jan to Mar) 2012 to Quarter 1 2018
Source: Office for National Statistics
Download this chart Figure 12: General insurance companies’ premiums and claims
Image .csv .xlsSelf-administered pension funds
Contributions to self-administered pension funds (net of refunds) in Quarter 1 2018 were £12 billion, broadly in line with the five-year quarterly average for this series.
Over 2017, the special contributions made to pension funds by companies remained at an elevated level compared with equivalent quarters in previous years. This may have been a reaction to the effects of quantitative easing in 2016, which pushed down long-term interest rates, negatively affecting pension liabilities levels. These elevated levels of special contributions were also apparent from 2009 to 2013 and the Bank of England engaged in quantitative easing throughout 2010 to 2012.
In recent years, we have tended to see a higher level of special contributions at Quarter 1, which may suggest that companies are more informed about the amount they can spend on pension liabilities prior to the tax year ending. This would lead to generally higher net contributions in this quarter compared with other quarters of the year (Figure 13). However, special contributions in Quarter 1 2018 do not follow this pattern, which may suggest that some companies are reviewing this strategy.
Payments (comprising pensions payable gross of income tax, lump sums payable on retirement and death benefits) by self-administered pension funds in Quarter 1 2018 were £14 billion, in line with the five-year quarterly average for this series.
Figure 13: Self-administered pension funds’ contributions (net of refunds) and payments
UK, Quarter 1 (Jan to Mar) 2012 to Quarter 1 2018
Source: Office for National Statistics
Download this chart Figure 13: Self-administered pension funds’ contributions (net of refunds) and payments
Image .csv .xls
Table 3: Income and expenditure by institutional group UK, Quarter 1 (Jan to Mar) 2012 to Quarter 1 2018
| £ billion | ||||||||||||||
| Long-term insurance | General insurance | Self-administered pension funds | ||||||||||||
|---|---|---|---|---|---|---|---|---|---|---|---|---|---|---|
| Premiums | Claims | Premiums | Claims | Contributions (net of refunds) | Payments | |||||||||
| 2012 | 113.6 | 146.8 | 37.4 | 24.1 | 48.6 | 51.4 | ||||||||
| 2013 | 108.2 | 152.0 | 37.3 | 24.2 | 47.3 | 53.9 | ||||||||
| 2014 | 116.8 | 153.5 | 36.0 | 22.7 | 41.1 | 51.6 | ||||||||
| 2015 | 127.5 | 161.9 | 35.6 | 22.5 | 40.6 | 53.6 | ||||||||
| 2016 | 130.0 | 163.8 | 34.6 | 21.7 | 47.4 | 54.6 | ||||||||
| 2017 | 159.1 | 187.2 | 35.6 | 23.2 | 50.6 | 55.3 | ||||||||
| Q1 2012 | 27.4 | 35.0 | 9.5 | 6.3 | 16.5 | 12.5 | ||||||||
| Q2 2012 | 28.6 | 37.4 | 9.8 | 5.7 | 10.4 | 13.0 | ||||||||
| Q3 2012 | 26.6 | 36.6 | 9.3 | 5.9 | 10.4 | 12.6 | ||||||||
| Q4 2012 | 30.9 | 37.8 | 8.7 | 6.3 | 11.4 | 13.4 | ||||||||
| Q1 2013 | 23.7 | 34.7 | 9.6 | 6.0 | 16.0 | 13.0 | ||||||||
| Q2 2013 | 30.6 | 38.8 | 9.6 | 6.0 | 10.0 | 13.2 | ||||||||
| Q3 2013 | 26.6 | 39.4 | 9.2 | 6.0 | 10.2 | 13.6 | ||||||||
| Q4 2013 | 27.3 | 39.1 | 8.8 | 6.3 | 11.0 | 14.0 | ||||||||
| Q1 2014 | 30.4 | 34.3 | 9.1 | 5.7 | 11.8 | 12.3 | ||||||||
| Q2 2014 | 29.3 | 39.0 | 9.6 | 5.8 | 9.3 | 12.9 | ||||||||
| Q3 2014 | 27.3 | 36.9 | 8.8 | 5.6 | 9.3 | 13.1 | ||||||||
| Q4 2014 | 29.8 | 43.3 | 8.6 | 5.5 | 10.7 | 13.2 | ||||||||
| Q1 2015 | 25.3 | 34.6 | 9.1 | 5.8 | 12.0 | 12.7 | ||||||||
| Q2 2015 | 28.2 | 47.9 | 9.2 | 5.5 | 9.3 | 13.2 | ||||||||
| Q3 2015 | 35.5 | 39.6 | 8.3 | 5.6 | 9.1 | 13.6 | ||||||||
| Q4 2015 | 38.4 | 39.8 | 9.1 | 5.7 | 10.3 | 14.2 | ||||||||
| Q1 2016 | 31.4 | 44.9 | 8.5 | 5.4 | 17.3 | 13.6 | ||||||||
| Q2 2016 | 30.9 | 38.3 | 8.7 | 5.2 | 9.6 | 13.6 | ||||||||
| Q3 2016 | 29.5 | 37.0 | 8.8 | 5.3 | 9.7 | 14.0 | ||||||||
| Q4 2016 | 38.3 | 43.6 | 8.6 | 5.9 | 10.8 | 13.4 | ||||||||
| Q1 2017 | 35.1 | 43.2 | 9.1 | 6.1 | 14.0 | 13.4 | ||||||||
| Q2 2017 | 37.4 | 47.5 | 8.7 | 5.2 | 13.6 | 13.8 | ||||||||
| Q3 2017 | 42.8 | 46.1 | 8.8 | 5.9 | 11.1 | 14.0 | ||||||||
| Q4 2017 | 43.9 | 50.5 | 9.0 | 5.9 | 11.8 | 14.0 | ||||||||
| Q1 2018 | 40.9 | 64.6 | 8.9 | 5.5 | 12.2 | 13.8 | ||||||||
| Source: Office for National Statistics | ||||||||||||||
| Notes: | ||||||||||||||
| 1. Components may not sum to totals due to rounding. | ||||||||||||||
| 2. Data for Quarter 1 2017 onwards remain provisional and subject to revision until the incorporation of the 2017 annual survey results in December 2018. | ||||||||||||||
| 3. Q1 is Quarter 1 (January to March), Q2 is Quarter 2 (April to June), Q3 is Quarter 3 (July to September) and Q4 is Quarter 4 (October to December). | ||||||||||||||
Download this table Table 3: Income and expenditure by institutional group UK, Quarter 1 (Jan to Mar) 2012 to Quarter 1 2018
.xls (38.4 kB)6. Holdings at market values
The most recently available annual balance sheet data, providing information on the market value of asset holdings, is for 2016 (Figure 14). Market value is the quoted price at which assets are bought or sold, at a given time. Increase or decrease in the total holdings of assets reflects both the revaluation of assets held through the year and the balance between the sales of some assets and the purchase of others (net investment or transactions).
The total assets held by insurance companies, pension funds and trusts (at market values) has increased each year since 2008 and at the end of 2016 was valued at £4,188 billion.
Figure 14: Values of holdings at market values by asset type
UK, 2016

Source: Office for National Statistics
Download this image Figure 14: Values of holdings at market values by asset type
.png (25.8 kB) .xls (31.7 kB)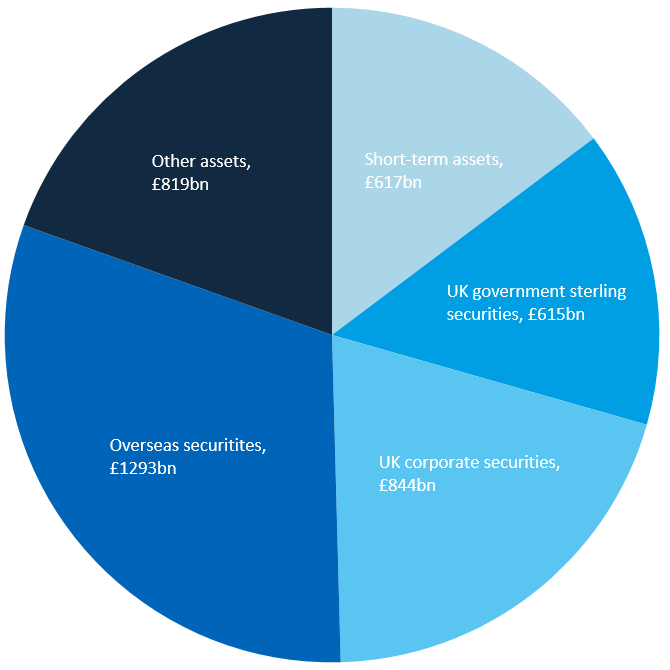
The Quarter 3 (July to Sept) 2018 release, due to be published in December 2018, will contain annual 2017 balance sheet information.
Back to table of contents7. Accessing MQ5 data
There are several ways to view the data underlying this release.
The MQ5: Investment by insurance companies, pension funds and trusts dataset shows data from both the quarterly and annual series:
- Tables A to D combine information from the different institutions
- Section 1 combines information from the long-term and general insurance surveys
- Section 2 covers information from the surveys of long-term insurance companies
- Section 3 covers information from the surveys of general insurance companies
- Section 4 covers information from the surveys of self-administered pension funds
- Section 5 covers information from the surveys of investment trusts
- Section 6 covers information from the surveys of unit trusts and property unit trusts
If you are interested in a particular series or groups of series covering a longer period of time (pre-2010), then you can access the Investment by Insurance Companies, Pension Funds and Trusts time series dataset.
There is scope to expand coverage of these datasets and/or add further datasets. We are keen to hear your views – please email us at financial.inquiries@ons.gov.uk.
Back to table of contents8. Revisions
A revisions policy is available to assist users with their understanding of the cycle and frequency of data revisions. You are strongly advised to read this policy before using these data for research or policy-related purposes.
Data for 2017 remain provisional and subject to revision, until the incorporation of the 2017 annual survey results in December 2018. Data for the quarters of 2017 have been revised, partly as a result of late questionnaires being received and partly as a result of disaggregate data revisions. For Quarter 4 (Oct to Dec) 2017, net investment has been revised upwards from net investment of £9 billion to net investment of £21 billion.
Revisions to data provide one indication of the reliability of main indicators. A spreadsheet is available giving a revisions triangle of estimates of net investment from 1996 to date.
Back to table of contents9. Response rates
The figures in this release are based on a system of quarterly and annual surveys collecting data on income and expenditure, transactions in financial assets and the balance sheet in separate surveys. Response rates in Quarter 1 (Jan to Mar) 2018 are broadly in line with previous quarters’ response rates.
Table 4: Overall response rate by survey Quarter 1 (Jan to Mar) 2018
| % | ||||||||||
| Transactions | ||||||||||
| Long-term insurance companies | 84 | |||||||||
| General insurance companies | 91 | |||||||||
| Self-administered pension funds | 79 | |||||||||
| Unit trusts | 99 | |||||||||
| Investment trusts | 93 | |||||||||
| Property unit trusts | 100 | |||||||||
| Income and expenditure | ||||||||||
| Long-term insurance companies | 88 | |||||||||
| General insurance companies | 92 | |||||||||
| Self-administered pension funds | 78 | |||||||||
| Source: Office for National Statistics | ||||||||||
Download this table Table 4: Overall response rate by survey Quarter 1 (Jan to Mar) 2018
.xls (32.8 kB)10. Quality and methodology
The Investment by insurance companies, pension funds and trusts (MQ5) Quality and Methodology Information report contains important information on:
- the strengths and limitations of the data and how it compares with related data
- uses and users of the data
- how the output was created
- the quality of the output including the accuracy of the data