Table of contents
- Main points
- Statistician’s comment
- Summary
- The UK economy grew by 0.4% in Quarter 4 2017, unrevised from the second estimate of GDP
- Growth in construction revised up in 2017, while services growth is revised down
- Household consumption grows at a modest 0.3% in Quarter 4 2017, while business investment remains subdued
- Growth in both compensation of employees and profits slow in Quarter 4 2017
- Households’ saving ratio hits a record low of 4.9% in 2017
- The UK’s current account deficit narrows to 4.1% of GDP in 2017, the narrowest deficit since 2011
- Growth in CPIH fell to 2.5% in February 2018, while growth in input and output PPI both fell to 3.4% and 2.6% respectively
- Unemployment remained at 4.3% in the three months to January 2018
1. Main points
The UK economy grew by 0.4% in Quarter 4 (Oct to Dec) 2017, unrevised from the second estimate of gross domestic product (GDP); on a calendar-year basis, the economy grew by an upwardly revised 1.8% in 2017.
There have been revisions to components of the output measure of GDP across 2017, with construction seeing the most marked revisions.
Estimates for the expenditure components of GDP show that private consumption, government consumption and gross fixed capital formation all contributed positively to growth in Quarter 4 2017, while net trade subtracted from growth.
The households’ saving ratio hit a record low of 4.9% in 2017, while the current account deficit is now at 4.1% of GDP – its narrowest since 2011.
Growth in the Consumer Prices Index including owner occupiers’ housing costs (CPIH) fell to 2.5% in February 2018, while growth in input and output Produce Price Index (PPI) both fell to 3.4% and 2.6% respectively.
Unemployment remained at 4.3% in the three months to January 2018, the same as in the previous quarter.
2. Statistician’s comment
Commenting on today’s national accounts figures, Head of National Accounts Rob Kent-Smith said:
“Economic growth at the end of last year was unrevised with services and manufacturing continuing to drive growth.
“Household borrowing increased throughout 2017, while their saving was the lowest on record. However, the UK’s deficit with the rest of the world shrank, as the UK received increased earnings on foreign investments thanks to a growing world economy.
“The services sector picked up in the three months to January 2018 with architecture, leasing companies and health work all boosting growth.”
Back to table of contents3. Summary
The UK economy grew by 0.4% in Quarter 4 (Oct to Dec) 2017, unrevised from the second estimate of gross domestic product (GDP). Data from the start of 2017 are open to revision. Small revisions to the quarterly path have led to an upward revision in annual growth in 2017. This release includes the incorporation of Value Added Tax (VAT) turnover data for the first time in Quarter 3 (July to Sept) 2017, while some additional VAT data have been included for earlier quarters.
The 12-month growth rate for the Consumer Prices Index including owner occupiers’ housing costs (CPIH) fell to 2.5% in February 2018. Housing, water, electricity, gas and other fuels has fairly consistently contributed the most to the 12-month growth rate of CPIH, between January 2013 and February 2018, contributing an average of 0.56 percentage points per month over the period. The core measures of input Producer Price Index (PPI), output PPI and CPIH follow broadly similar trends but recent falls in core input PPI have not yet fed through into output PPI and CPIH.
In the three months to January 2018, unemployment was 4.3% whilst employment stood at 75.3%. Wage growth was slow despite recent low unemployment, which could be explained by sluggish public sector wages due to the public sector pay cap, or an increase in underutilisation amongst those in employment.
More detailed theme day economic commentary is available for:
Back to table of contents4. The UK economy grew by 0.4% in Quarter 4 2017, unrevised from the second estimate of GDP
Today’s Quarterly national accounts show that the UK economy grew by 0.4% in Quarter 4 (Oct to Dec) 2017 (Figure 1), unrevised from the second estimate of gross domestic product (GDP) published on 22 February 2018. Quarter-on-year GDP growth was 1.4% in Quarter 4 2017, the slowest rate since Quarter 2 (Apr to June) 2012. Data from the start of 2017 are open to revision. While GDP growth in Quarter 4 2017 was unrevised, today’s figures show an upward 0.1 percentage points revision to Quarter 1 2017 growth and a downward 0.1 percentage points revision in Quarter 2 2017.
Figure 1: Gross domestic product growth, quarter-on-quarter and quarter on same quarter a year ago growth rate
UK, Quarter 1 (Jan to Mar) 2008 to Quarter 4 (Oct to Dec) 2017
Source: Office for National Statistics
Notes:
- Q1 refers to Quarter 1 (Jan to Mar), Q2 refers to Quarter 2 (April to June),Q3 refers to Quarter 3 (July to Sept),Q4 refers to Quarter 4 (Oct to Dec).
Download this chart Figure 1: Gross domestic product growth, quarter-on-quarter and quarter on same quarter a year ago growth rate
Image .csv .xlsThese revisions to the 2017 quarterly path have resulted in an upward revision to annual growth, with the economy now estimated to have grown by 1.8% in 2017. This is a slight slowing from the 1.9% seen in 2016. However, the UK is the only G7 economy to see a slowing in annual growth in 2017 (Figure 2), with the UK now the fifth fastest growing in the G7, ahead of only Japan and Italy.
Figure 2: Comparison of annual gross domestic product growth in G7 economies, chained-volume measure
2016 versus 2017
Source: Office for National Statistics and Organisation for Economic Co-operation and Development
Notes:
- These figures are the latest available estimates at the time of preparation of this commentary and may subsequently have been revised.
Download this chart Figure 2: Comparison of annual gross domestic product growth in G7 economies, chained-volume measure
Image .csv .xls5. Growth in construction revised up in 2017, while services growth is revised down
Today’s March Quarterly national accounts publication incorporates Value Added Tax (VAT) turnover data in estimates of output gross value added (GVA) for Quarter 3 (July to Sept) 2017 for the first time. It also includes updated VAT data for Quarter 1 (Jan to Mar) 2017 and Quarter 2 (Apr to June) 2017. The incorporation of VAT data, together with updated Monthly Business Survey (MBS) estimates, have led to a 0.1 percentage points downward revision in the growth of the output measure of gross domestic product (GDP) in both Quarter 2 2017 and Quarter 3 2017. Figure 3 shows the decomposition of these revisions to output GVA by sector, weighted by their contribution to GDP.
Figure 3: Decomposition of revisions to output gross value added by sector
UK, Quarter 1 (Jan to Mar) 2017 to Quarter 4 (Oct to Dec) 2017
Source: Office for National Statistics
Notes:
Chart excludes revisions to agriculture.
Components may not sum to revisions in gross domestic product due to rounding.
GDP figures are to one decimal place and sector revisions are to two decimal places.
Q1 refers to Quarter 1 (Jan to Mar), Q2 refers to Quarter 2 (April to June), Q3 refers to Quarter 3 (July to Sept), Q4 refers to Quarter 4 (Oct to Dec).
Download this chart Figure 3: Decomposition of revisions to output gross value added by sector
Image .csv .xlsConstruction has seen the most marked revisions, with growth revised up in each quarter in 2017 (Figure 3). The largest revision was in Quarter 3 2017, with output now estimated to have grown by 0.4% following an upward revision of 0.7 percentage points. These revisions have altered the quarterly path in 2017, with construction output no longer recording three consecutive quarters of decline, as previously estimated (Figure 4).
Construction output was also revised up in Quarter 4 (Oct to Dec) 2017 and is now estimated to have fallen by 0.1%, up from a previously estimated fall of 0.7%. As a result, annual growth in construction output has also been revised up from 5.1% to 5.7%, the strongest annual growth rate since 2014. This was driven by strong growth through 2016 and into the first quarter of 2017.
Figure 4: Revisions to quarterly growth in real construction output
UK, Quarter 1 (Jan to Mar) 2017 to Quarter 4 (Oct to Dec) 2017
Source: Office for National Statistics
Notes:
- Q1 refers to Quarter 1 (Jan to Mar), Q2 refers to Quarter 2 (April to June), Q3 refers to Quarter 3 (July to Sept), Q4 refers to Quarter 4 (Oct to Dec).
Download this chart Figure 4: Revisions to quarterly growth in real construction output
Image .csv .xlsWhile construction output estimates have been revised up, there have been downward revisions to both production and services growth in 2017. Today’s figures show that total production output grew by 0.4% in Quarter 4 2017, revised down from 0.5%. Production output growth has also been revised in Quarter 3 2017 from 1.4% to 1.0%. These revisions have seen annual production growth revised down from 2.1% to 1.9% in 2017. Despite this revision, this is the strongest annual growth in production output since 2010 – driven primarily by strength in manufacturing. While there was a downward revision of 0.3 percentage points in annual manufacturing growth, output still grew by a solid 2.5% in 2017 – its strongest rate since 2014.
Meanwhile, services output growth in Quarter 4 2017 was revised down by 0.2 percentage points to 0.4%, driven primarily by a downward revision of 0.3 percentage points to business services and finance. However, it still marked the strongest quarterly growth rate for services output in 2017. Together with minor revisions in the first three quarters of 2017, annual growth in services was revised down slightly from 1.6% to 1.5% – the weakest annual growth since 2011. Quarter-on-year growth in services output has been slowing since Quarter 3 2016, driven largely by consumer-focused industries such as retail trade.
Despite the slowdown in 2017, today’s new Index of Services figures show that total services output rose by 0.6% in the three months to January 2018, the largest three-month on three-month growth since December 2016 (Figure 5). This was driven by the business services and finance, and transport, storage and communication sectors.
Business services and finance was the most consistent performer in 2017, and has now been the strongest contributor to three-month on three-month services growth for seven consecutive months (Figure 5). This may in part reflect increased demand for professional services from EU clients seeking advice on the establishment of UK operations to retain market access or on the acquisition of UK assets – as indicated in the Bank of England’s Agents’ summary survey for Quarter 4 2017.
Meanwhile, a particularly strong December saw transport, storage and communications grow by 1.3% in the three months to January 2018 – its strongest rate since December 2016. For the fourth consecutive month, the distribution, hotels and restaurants sector made zero contribution to growth in the three months to January 2018 (to one decimal place) – the first time this has occurred on record.
Figure 5: Growth in total services output and industry contributions, three-month on three-month
UK, January 2016 to January 2018
Source: Office for National Statistics
Notes:
1. Components may not sum to gross domestic product due to rounding.
Download this chart Figure 5: Growth in total services output and industry contributions, three-month on three-month
Image .csv .xls6. Household consumption grows at a modest 0.3% in Quarter 4 2017, while business investment remains subdued
Today’s estimates for the expenditure components of gross domestic product (GDP) show that private consumption, government consumption and gross fixed capital formation all contributed positively to growth in Quarter 4 (Oct to Dec) 2017, while net trade subtracted from growth (Figure 6).
Figure 6: Contributions to gross domestic product growth, expenditure component, quarter-on-quarter, chained-volume measure
UK, Quarter 1 (Jan to Mar) 2016 to Quarter 4 (Oct to Dec) 2017
Source: Office for National Statistics
Notes:
Components may not sum to gross domestic product due to rounding.
Q1 refers to Quarter 1 (Jan to Mar), Q2 refers to Quarter 2 (April to June), Q3 refers to Quarter 3 (July to Sept), Q4 refers to Quarter 4 (Oct to Dec).
Download this chart Figure 6: Contributions to gross domestic product growth, expenditure component, quarter-on-quarter, chained-volume measure
Image .csv .xlsHousehold consumption increased by 0.3% in Quarter 4 2017, unrevised from the previously published estimate. While annual growth has been revised down by 0.1 percentage points to 1.7% in 2017, the recent picture on consumption remains largely unchanged. Household spending has been subdued over the past year, with quarter-on-year growth slowing for the sixth consecutive quarter in Quarter 4 2017 to be at its lowest rate since Quarter 1 (Jan to Mar) 2012. This has been driven partly by net tourism, which has been declining since Quarter 3 (July to Sept) 2016 and recorded negative quarter-on-year growth in each quarter of 2017.
Changes in tourism expenditure are likely to reflect recent movements in sterling. The sterling exchange rate index (ERI) has depreciated by 16.4% since Quarter 3 2015, which is likely to have reduced expenditure by UK travellers abroad and boosted expenditure by overseas residents travelling in the UK, resulting in a decline in net tourism.
Gross fixed capital formation (GFCF) increased by 1.1% in Quarter 4 2017, unrevised from the second estimate of GDP. This quarterly increase was broad-based across the main components of GFCF, with growth recorded in business, government and dwelling investment.
Growth in business investment has been relatively weak over the past two years and grew at a modest 0.3% in Quarter 4 2017. This was despite an upward revision of 0.3 percentage points compared with the second estimate of GDP. In annual terms, business investment picked up to grow by 2.4% in 2017 – stronger than its 2016 outturn but below its five-year average annual growth rate of 2.8%. Growth in 2017 was almost entirely driven by non-manufacturing business investment, particularly in private non-distributive services, which contributed 2.0 percentage points to annual growth. Within private non-distributive services, the largest positive growth contributor was information and communications.
The UK trade deficit widened to 1.5% of GDP in Quarter 4 2017, revised down from the 2.1% in the second estimate of GDP. This was driven by downward revisions to goods imports, particularly unspecified goods, and upward revisions to services exports. In volume terms, exports fell by 0.9% and imports rose by 0.4% in Quarter 4 2017, as net trade subtracted from quarterly GDP growth.
The fall in exports was driven primarily by a 21.4% decline in fuel exports. This decline in fuel may reflect the sharp decline in domestic oil production in December 2017 due to the unexpected shutdown of the Forties Pipeline System for emergency repair. While the quarterly fall in exports was sharper than previously estimated (a downward revision of 0.7 percentage points), annual exports growth has been revised up to 5.7%. This is due mainly to a large upward revision in Quarter 3 2017, with both goods and services exports stronger than previously estimated.
The year 2017 marks the strongest annual growth in exports since 2011 and was driven by a particularly strong performance in goods exports (7.1%). Services exports also saw a rise of 3.9% in 2017. Meanwhile, annual growth in imports has been revised down from 3.5% to 3.2%, as net trade contributed 0.6 percentage points to annual GDP growth in 2017. This is the first positive net trade contribution since 2011.
Back to table of contents7. Growth in both compensation of employees and profits slow in Quarter 4 2017
Nominal gross domestic product (GDP) increased by an unrevised 0.7% in Quarter 4 (Oct to Dec) 2017, with all components making positive growth contributions except taxes less subsidies (Figure 7). Growth in compensation of employees (CoE) has continued to slow, with growth in other income picking up to 1.2% in Quarter 4 2017.
CoE was also the driver of annual growth in 2017, contributing over half of the 3.8% growth in nominal GDP. This reflected growth in both wages and salaries and employers’ social contributions, with the latter recording its strongest annual growth since 2010 (6.8%). While today’s figures incorporate some minor revisions to the quarterly path of CoE in 2017, the profile remains largely unchanged with annual growth in CoE unrevised from previously published estimates.
There have, however, been larger revisions in gross operating surplus (GOS) and other income across 2017. Annual growth in GOS is now estimated to have grown by 4.0% in 2017, an upward revision of 0.5 percentage points from previous estimates.
Figure 7: Contributions to nominal gross domestic product growth by income component, quarter-on-quarter
UK, Quarter 1 (Jan to Mar) 2015 to Quarter 4 (Oct to Dec) 2017
Source: Office for National Statistics
Notes:
Components may not sum to nominal gross domestic product due to rounding and loss of additivity in data prior to open period. The statistical discrepancy is also not displayed.
Q1 refers to Quarter 1 (Jan to Mar), Q2 refers to Quarter 2 (April to June), Q3 refers to Quarter 3 (July to Sept), Q4 refers to Quarter 4 (Oct to Dec).
Download this chart Figure 7: Contributions to nominal gross domestic product growth by income component, quarter-on-quarter
Image .csv .xls8. Households’ saving ratio hits a record low of 4.9% in 2017
The Quarterly sector and financial accounts published today provide further information about the UK economy. The households’ saving ratio was 5.2% in Quarter 4 (Oct to Dec) 2017 (Figure 8), while it was the lowest annual households’ saving ratio on record in 2017 (4.9%). The saving ratio hit a historical low in Quarter 1 (Jan to Mar) 2017, which reflected a large increase in taxes on income and wealth due to the timing of payment of taxes on self-reported income and capital gains. This effect unwound subsequently in Quarter 2 (Apr to June) 2017, with a rise in the saving ratio, although it has remained low compared with recent levels.
The low saving ratio reflects a rundown of savings by households as growth in consumption spending continues to outstrip growth in disposable income. Real household disposable income (RHDI) grew by 0.1% in Quarter 4 2017 and by 0.3% on an annual basis – its weakest annual rate since 2011. While gross disposable income rose by 2.3% in 2017, this was largely offset by a 2.0% rise in the household expenditure implied deflator. Revisions to both RHDI and the households’ saving ratio have been incorporated from Quarter 1 (Jan to Mar) 2017. While there was a downward revision of 0.1 percentage points to RHDI in Quarters 1, 2 and 3 of 2017, the quarterly profile for the saving ratio was largely unchanged.
The rundown of household savings is also reflected in the net lending or borrowing position of households over recent quarters. Figure 9 shows that the households sector, which has traditionally been a net lender, was a net borrower of 0.4% of gross domestic product (GDP) in Quarter 4 2017. Households have now been a net borrower for five consecutive quarters – the first time this has occurred in history – while it was a net borrower in 2017 of 0.7%, the first time on record.
Today’s figures show that all domestic sectors, except non-profit institutions serving households (NPISH) were net borrowers in 2017, with general government being the largest borrower at 2.2% of GDP. That said, the net borrowing position of general government is the lowest since 2002. Revisions have been incorporated across 2017, with the most significant revisions in the non-financial corporations and external sectors. While the net borrowing position of non-financial corporations has been revised up by between 0.4 to 0.7 percentage points of GDP in Quarters 1, 2 and 3 of 2017, the current account deficit has been revised down.
Figure 8: Households' saving ratio, seasonally adjusted
UK, Quarter 1 (Jan to Mar) 2010 to Quarter 4 (Oct to Dec) 2017
Source: Office for National Statistics
Notes:
- Q1 refers to Quarter 1 (Jan to Mar), Q2 refers to Quarter 2 (April to June), Q3 refers to Quarter 3 (July to Sept), Q4 refers to Quarter 4 (Oct to Dec).
Download this chart Figure 8: Households' saving ratio, seasonally adjusted
Image .csv .xls
Figure 9: Net lending or borrowing position by sector, percentage of nominal gross domestic product
UK, Quarter 1 (Jan to Mar) 2010 to Quarter 4 (Oct to Dec) 2017
Source: Office for National Statistics
Notes:
- Q1 refers to Quarter 1 (Jan to Mar), Q2 refers to Quarter 2 (April to June), Q3 refers to Quarter 3 (July to Sept), Q4 refers to Quarter 4 (Oct to Dec).
Download this chart Figure 9: Net lending or borrowing position by sector, percentage of nominal gross domestic product
Image .csv .xls9. The UK’s current account deficit narrows to 4.1% of GDP in 2017, the narrowest deficit since 2011
The UK’s current account deficit narrowed to 4.1% of gross domestic product (GDP) in 2017, the narrowest deficit since 2011 (Figure 10). In recent years, the current account deficit has widened to historically high levels, driven by a deterioration in the UK’s net investment income. The narrowing from 5.8% in 2016 marks the first annual narrowing since 2011.
Today’s new data incorporate some revisions to the current account deficit, the most notable being to Quarter 3 (July to Sept) 2017, where it has been revised from 4.5% to 3.7%. There was a slight narrowing in Quarter 4 (Oct to Dec) 2017 to 3.6% of GDP, driven by a £1.8 billion narrowing of the primary income deficit – mainly foreign direct investment (FDI), with a £0.5 billion increase in FDI income received and a fall of £0.6 billion in FDI income paid out. This saw net FDI income rise to its highest level since Quarter 1 (Jan to Mar) 2014. The quarterly movement in the current account also reflected a £1.4 billion narrowing of the secondary income deficit, partly offset by a £2.5 billion widening of the trade deficit.
The narrowing of the secondary income deficit was due mainly to government payments decreasing as the European Union (EU) adjusted each member states' contributions in Quarter 4 2017. It should be noted that the quarterly path of net contributions to EU institutions can be erratic and change year-on-year due to the timing of payments and adjustments.
Financial flows in and out of the UK can be volatile. The current account deficit in Quarter 4 2017 was financed by a £61.4 billion net inflow of portfolio investment, with a £59.8 billion inflow of investment into the UK and a £1.6 billion reduction in portfolio investment holdings by UK investors abroad. On an annual basis, the deficit in 2017 was primarily financed by net inflows of both portfolio and other investment (£68.1 billion and £82.0 billion respectively), while direct investment recorded a net outflow of £65.7 billion. This marks the first annual net outflow of FDI since 2011, with the level of gross FDI outflows now at its highest since 2007. This compares with a net inflow of investment of £161.9 billion in 2016. The large movements recorded in FDI flows in 2016 and 2017 are mainly attributable to a small number of high-value mergers and acquisitions (M&A) deals, each in excess of £10 billion, completed in those years.
Reflecting this, the UK’s net international investment position (NIIP) worsened in 2017, with its stock of net external liabilities rising from £86.2 billion (4.4% of GDP) at the end of 2016 to £260.0 billion (12.8% of GDP) at the end of 2017. This rise also reflects revisions to the NIIP that have been incorporated into today’s figures, with net external liabilities revised up by £54.3 billion in Quarter 2 (Apr to June) 2017 and £81.3 billion in Quarter 3 2017. The upward revision in net external liabilities for Quarter 3 2017 is despite a narrower current account deficit than previously estimated. This is due to the impact of movements in exchange rates and price revaluations, which affect the UK’s stock of assets and liabilities. In Quarter 4 2017, net external liabilities fell by £38.9 billion from a revised £298.9 billion (14.8% of GDP) at the end of Quarter 3 2017.
Figure 10: Decomposition of current account balance, percentage of gross domestic product
UK, Quarter 1 (Jan to Mar) 2015 to Quarter 4 (Oct to Dec) 2017
Source: Office for National Statistics
Notes:
Components may not sum to current account balance due to rounding.
Q1 refers to Quarter 1 (Jan to Mar), Q2 refers to Quarter 2 (April to June), Q3 refers to Quarter 3 (July to Sept), Q4 refers to Quarter 4 (Oct to Dec).
Download this chart Figure 10: Decomposition of current account balance, percentage of gross domestic product
Image .csv .xls10. Growth in CPIH fell to 2.5% in February 2018, while growth in input and output PPI both fell to 3.4% and 2.6% respectively
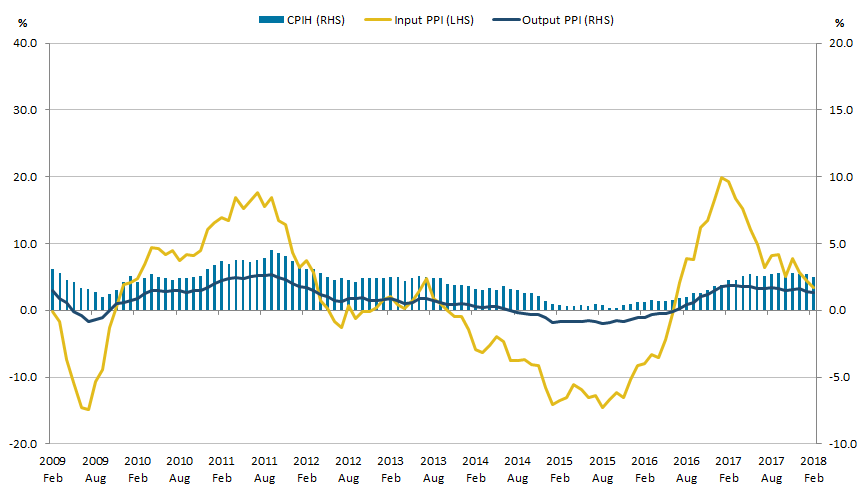
The 12-month growth rate of the Consumer Prices Index including owner occupiers’ housing costs (CPIH) fell to 2.5% in February 2018. The input Producer Price Index (input PPI) grew by 3.4% in the 12 months to February 2018, down from 4.5% in the 12 months to January 2018; while the output Producer Price Index (output PPI) grew by 2.6% in the 12 months to February 2018, down from 2.8% in the 12 months to January 2018.
Figure 11: Annual growth rate for input Producer Price Index (PPI) (left-hand side), output PPI and Consumer Prices Index including owner occupiers' housing costs (CPIH) (right-hand side)
UK, February 2009 to February 2018
Source: Office for National Statistics
Download this image Figure 11: Annual growth rate for input Producer Price Index (PPI) (left-hand side), output PPI and Consumer Prices Index including owner occupiers' housing costs (CPIH) (right-hand side)
.png (23.3 kB) .xls (35.3 kB)
Figure 12 shows the contributions to the 12-month growth rate of the CPIH by category of spending. Housing, water, electricity, gas and other fuels has fairly consistently contributed the most to the 12-month growth rate of CPIH, between January 2013 and February 2018, contributing an average of 0.56 percentage points per month over the period.
In the most recent month, February 2018, the 12-month growth rate for CPIH has fallen to 2.5%, down from 2.7% in January 2018. This reflects decreasing inflation across a range of goods and services, with the majority of components of CPIH contributing less to the headline rate in February 2018 than they did in January 2018.
Figure 12: Contributions to the growth rate of the Consumer Prices Index including owner occupiers' housing costs (CPIH) by category of spending
UK, January 2013 to February 2018
Source: Office for National Statistics
Notes:
- Contributions may not sum due to rounding.
Download this chart Figure 12: Contributions to the growth rate of the Consumer Prices Index including owner occupiers' housing costs (CPIH) by category of spending
Image .csv .xlsFigure 13 shows the 12-month growth rates for core components of the input PPI and output PPI and the CPIH. The purpose of the core series is to strip away the more volatile components in each measure that are prone to temporary shocks, which may mask the underlying inflation level, making the 12-month growth rate more stable than in the aggregate series. All three core series exclude food, beverages and tobacco while core input PPI also excludes petroleum-based products (FBTP) and core CPIH also excludes energy1.
Figure 13: Core input and output Producer Price Index and core Consumer Prices Index including owner occupiers' housing costs, 12-month growth rate
UK, January 2007 to February 2018

Source: Office for National Statistics
Download this image Figure 13: Core input and output Producer Price Index and core Consumer Prices Index including owner occupiers' housing costs, 12-month growth rate
.png (31.8 kB) .xls (39.9 kB)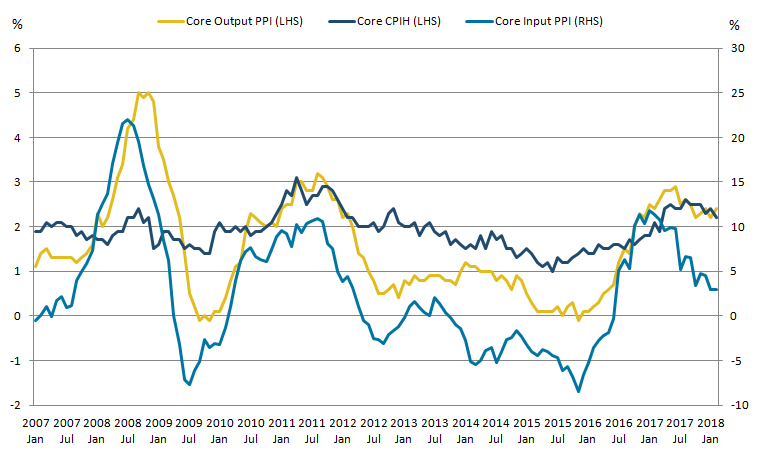
Previous analysis shows that components of core input PPI tend to broadly track the sterling effective exchange rate, due to core input PPI containing a large proportion of imported goods. Similarly, the movements in core output PPI appear to broadly track movements in core input PPI but with a slight lagged effect. This suggests that changes to the cost of inputs take time to translate into changes in the price of outputs, which may be due partly to fixed-term contracts between suppliers of inputs and producers.
Figure 13 also shows that core CPIH appears to broadly track core output PPI but with more muted movements and little to no lagged effect. The 12-month growth rate in core input PPI has been falling fairly consistently since January 2017, while the 12-month growth rates for core output PPI and core CPIH have been relatively flat over recent months, suggesting that the falls seen in the 12-month growth rate of input PPI have not yet fed through into core output PPI and core CPIH.
Notes for: Growth in CPIH fell to 2.5% in February 2018, while growth in input and output PPI both fell to 3.4% and 2.6% respectively
- The energy component of CPIH is made up of electricity, gas and other fuels, and fuels and lubricants.
11. Unemployment remained at 4.3% in the three months to January 2018
Latest estimates from the Labour Force Survey show that the number of unemployed people increased by 24,000 to 1.45 million in the three months to January 2018, when compared with August to October 2017. The slight increase in the number of unemployed people was insufficient to have a material impact on the unemployment rate, which stayed at 4.3% in the three months to January 2018, unchanged on the previous quarter.
Broken down by gender, the unemployment rate for women increased by 0.3 percentage points. The age breakdown does not reveal any obvious generational pattern, however, it is worth mentioning that unemployment is at a record low level for 25- to 34-year-olds.
Figure 14: Unemployment and employment rate
UK, seasonally adjusted, November to January 2006 to November to January 2018
Source: Office for National Statistics, Labour Force Survey
Download this chart Figure 14: Unemployment and employment rate
Image .csv .xlsEmployment
Employment continued to rise. In the three months to January 2018, there were 32.25 million people in work, which was 402,000 more than for the same period a year earlier and 168,000 more than the previous quarter. This change was driven by full-time employees, whose number rose by 182,000 to 20.29 million in the three months to January 2018, when compared with the previous quarter.
By way of context, Figure 15 plots quarter-on-quarter growth rates of real gross domestic product (GDP) and employment. Output depends on the amount of labour used in production; but the link between the two variables is less straightforward than that relationship alone. Economic growth leads to job creation and therefore higher employment. However, that growth can take place in less labour-intensive sectors, or sectors with limited ability to employ additional labour (for example, in a situation of skills mismatches).
Similarly, the job destruction rate tends to be lower than the fall in GDP at the time of recessions – the regulatory framework and labour hoarding can considerably soften the impact of output contraction on the labour market.
Figure 15: Quarter-on-quarter growth rates of real gross domestic product and employment
UK, seasonally adjusted, March 1999 to December 2017
Source: Office for National Statistics
Download this chart Figure 15: Quarter-on-quarter growth rates of real gross domestic product and employment
Image .csv .xlsFor the aforementioned reasons, the growth in employment is positively correlated but lower than economic growth. This can be clearly seen in the years before the downturn where the quarter-on-quarter GDP growth is, on average, above the changes in employment. Following the recession, however, the rates have converged.
As evidenced by the European Central Bank in 2016, similar but more moderate convergence was taking place in the Euro zone (PDF, 176.7KB). The correlation between output and employment growth was higher than previously, which could be explained partly by concentrated output growth in sectors with high labour intensity but weakly performing wages, such as services, trade and transport. The higher than average proportion of part-time workers in some of those growing sectors was also found to have contributed to slower overall wage growth in the Euro zone.
The following sections look at some of the changes in employment patterns that took place in the UK since the end of the last economic downturn.
Trends in self-employment
Compared with the previous quarter, the total number of self-employed workers continued to fall, this time driven by a 28,000 decrease in the number of part-time self-employed out of the overall net fall of 27,000 (in other words, the number of full-time self-employed rose). The number of people in self-employment fell by 22,000 in November 2017 to January 2018, compared with the same period a year earlier.
However, the recent decline in the number of self-employed came after a prolonged period of rapid growth, particularly among those working part-time. Over the last decade – since November to January 2008 to the same period in 2018 – the number of part-time self-employed increased by 30%. The number of full-time self-employed was rising at a much slower pace (but still fast compared with the number of employees) leading to an increase of 8% over the same time period.
Such disproportionate growth in part-time workers remained a feature of self-employment. By way of context, the number of employees working full-time grew by 6.21% and part-time by 8.43% between November to January 2008 and November to January 2018. In other words, the overall change in the number of employees did not show signs of similarly substantial rebalancing between the working patterns.
Figure 16: Self-employed by working pattern
UK, seasonally adjusted, November to January 2006 to November to January 2018
Source: Office for National Statistics, Labour Force Survey
Download this chart Figure 16: Self-employed by working pattern
Image .csv .xlsWage growth, working pattern and contract type
One could expect nominal wage growth to be relatively high, following the recent UK record-low unemployment since 1975. The real wage growth may be harder to predict because inflation can be induced by various external pressures, such as the sterling depreciation, however, in the medium term, you could expect it to be positive in the existing economic climate. This has not been the case, with real wage growth staying between negative 0.6% and positive 0.6% excluding bonuses during 2017.
It remains the case that for any 100 people who work part-time, the number of people who want to work more hours is higher now than it was prior to the economic downturn. What this suggests is that there is a higher degree of underutilization among people in employment.
Similar to the case of part-time workers who could not find a full-time job, the number of temporary workers who could not find a permanent job started decreasing thereafter but remained relatively high and is growing again – perhaps a sign of economic uncertainty. As indicated previously, on average, such workers would be earning less than their permanent counterparts, adjusted for job and personal characteristics.
Public and private sector wage growth
Figure 17: Public and private sector real wage growth
UK, regular pay growth, three-month on three-month a year ago, seasonally adjusted, January to March 2006 to November to January 2018

Source: Office for National Statistics, Monthly Wages and Salaries Survey
Download this image Figure 17: Public and private sector real wage growth
.png (56.2 kB) .xls (27.1 kB)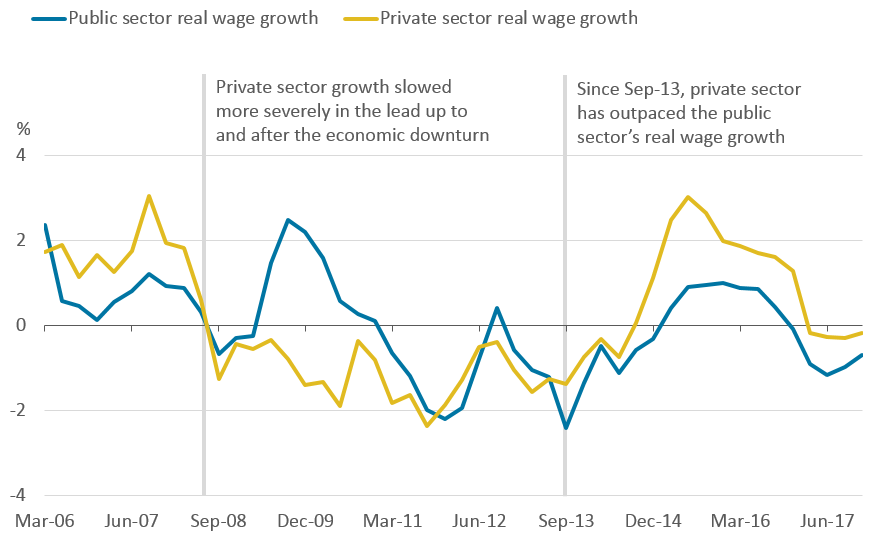
One particular category of employees whose wages are less responsive to the situation in the labour market are public sector employees. Figure 17 shows that since April 2014, the private sector has outpaced the public sector’s nominal and real wage growth. Growth in public sector real wages has been negative since November 2016. In the private sector, growth remained positive until February 2017.
A large proportion of public sector employees were subject to the public sector pay cap, preceded by temporary freezes. These restraints, which limited the pay rises to an average of 1% per year for most categories of public sector employees, have been in place since 2010. The rise in inflation therefore pushed the real wage growth in the public sector quicker and further into the negative zone.
Figure 18: Public and private sector employment
UK, seasonally adjusted, March 2006 to December 20171
Source: Office for National Statistics, Labour Force Survey and returns from public sector organisations
Notes:
- During this time period, there were a number of revisions to the classifications of companies which, in turn, had a considerable impact on employment figures. Such revisions may have been caused by change to the statistical and regulatory frameworks or legislation.
Download this chart Figure 18: Public and private sector employment
Image .csv .xlsPublic sector employment represented only 16.6% of all in employment in December 2017. Furthermore, Figure 18 shows that employment in the public sector has been almost continuously falling, from 22.2% of all in employment in March 2010 to 16.6% in the latest period, a decrease of around 1.09 million workers1. Having said this, public sector workers, per capita, contributed more highly to the negative real wage growth than private sector workers.
Notes for: Unemployment remained at 4.3% in the three months to January 2018
- Note that the changes in stock, that is, a number of workers at a point in time, should not be interpreted as flows. For example, a nominal decrease in public sector employment does not necessarily lead to an increase in private sector employment, because this individual could leave the workforce or work in a non-profit industry.
Contact details for this Article
Related publications
- Quarterly sector accounts, UK: October to December 2017
- Index of Services, UK: January 2018
- Consumer trends, UK: October to December 2017
- Business investment in the UK: October to December 2017 revised results
- GDP quarterly national accounts, UK: October to December 2017
- Balance of payments, UK: Quarter 4 (Oct to Dec) 2017