
1. Main points
The number of jobs in Manufacturing fell by 51%, from 264,000 to 129,000 jobs in London between 1996 and 2015. It was almost the only industry to lose jobs over the period, whereas jobs in London as a whole grew by 40%.
23.7% of employee jobs in Manufacturing in London were earning below the London Living Wage in 2015, up from 19.3% in 2014, and real average (median) hourly earnings (excluding overtime) in Manufacturing in London have fallen over time, from £16.71 in 2008 to £13.94 in 2015, in 2015 prices. Real earnings have been calculated using national Consumer Prices Index figures, as data are not available at the London level.
90% of Manufacturing workplaces stated that access to local amenities, cultural activities, parks, sporting and recreational facilities was of slight or no importance to their business, although 91% were satisfied or very satisfied with the amenities they had, according to the 2014 London Business Survey.
Back to table of contents2. Introduction
Manufacturing covers the production of a wide variety of goods and materials, including food, clothing, fuels and chemicals, machinery, electronic equipment, and vehicles. It also covers the repair and maintenance of these goods. Gross Value Added (GVA) data indicate that, as of 2014, Manufacturing in London generated £9,561 million of GVA. This was 2.6% of London’s overall GVA, 5.6% of Manufacturing GVA across the UK and 0.6% of UK GVA overall. Provisional results from UK Manufacturers' Sales by Product (PRODCOM) show that UK manufacturers’ total product sales were £364.6 billion in 2015.
However, we are focusing on Manufacturing in London. This article starts by identifying the declining number of jobs in Manufacturing, then comments upon the age structure, countries of birth, qualification levels and occupations of workers in the sector. We then review pay of employees in Manufacturing, with reference to the London Living Wage, and conclude by investigating where employees are located across the capital and how those businesses feel about being located in London.
The industrial sectors analysed in this article are based upon the UK Standard Industrial Classification (SIC) 2007, but because of the structure of London’s economy we group industrial sections A, B, D and E to create the group “Primary and Utilities”, and split section G into 2 parts: “Wholesale and Motor Trades”, which is the combination of industrial divisions 45 and 46, and “Retail”, which is division 47. We typically exclude sections T and U from the analysis as they are too small in London to analyse effectively. When this article refers to the term “Retail” it means industrial SIC division 47, and it is large enough in London to be compared to the other industry sections.
This analysis is part of a series of articles entitled Earning, Learning and Business Churning: revealing London's industrial economy, which analyse patterns of activity in industries in London. Data used in this analysis has been used to create the Economic Evidence Base by the Greater London Authority, which forms the economic basis of the Mayor of London’s London Plan. This article gives detail about a particular industrial sector, whereas the Economic Evidence Base provides a more comprehensive understanding of London’s economy.
Back to table of contents3. Declining jobs in Manufacturing in London
Manufacturing is almost the only industry in London in which numbers of jobs have fallen. Between 1996 and 2015, the number of jobs in Manufacturing in London fell by 51%, from 264,000 to 129,000 jobs, according to Workforce Jobs estimates. Over the same period, only 2 other industry sectors fell: Public Administration and Defence fell by 4,000 jobs (down 2%), and Wholesale and Motor Trades fell by 13,000 jobs (down 6%), but neither fell by anywhere near as much as Manufacturing.
Figure 1: Numbers of jobs in selected industrial sectors in London, 1996 to 2015

Source: Office for National Statistics – Workforce Jobs estimates
Download this image Figure 1: Numbers of jobs in selected industrial sectors in London, 1996 to 2015
.png (28.4 kB) .xls (195.1 kB)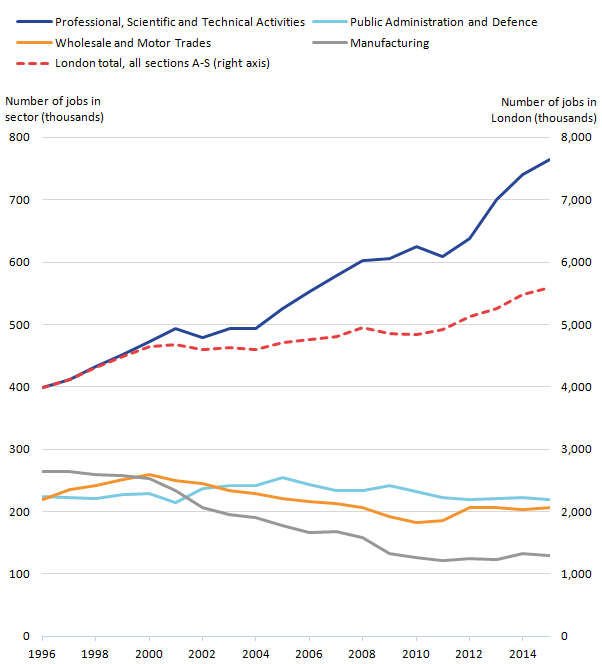
Overall, the number of jobs in London grew by 40% between 1996 and 2015, and in particular jobs in Professional, Scientific and Technical Activities grew by 92%, meaning Manufacturing is in stark decline compared with London’s general employment trends. However, Manufacturing in London is reflecting a nationwide trend, where Workforce Jobs in Manufacturing across the UK fell from 4.3 million in December 1996 to 2.7 million in December 2015, a fall of 38%, with the pattern of this fall being fairly gradual over time.
According to the Inter-Departmental Business Register (IDBR), the number of workplaces1 in Manufacturing in London has also fallen, from 18,255 in 2001 to a low of 11,925 in 2011. The numbers have since risen to 13,225 in 2015, although part of this rise may be a result of changes to the source data in 2012 and 20152.
The age structure of jobs in Manufacturing, according to the Annual Population Survey, was similar to that of jobs in London as a whole in 2015. We can see in Figure 2 that approximately one-quarter of jobs were held by people aged 25 to 34, another quarter of jobs by people aged 35 to 44, another quarter aged 45 to 54, and the remaining quarter split between the younger and older ages.
Figure 2: Percentage of jobs in each age group in London, 2015
Source: Office for National Statistics – Annual Population Survey
Download this chart Figure 2: Percentage of jobs in each age group in London, 2015
Image .csv .xlsIn fact, Manufacturing is similar to London’s structure regarding country of birth as well, with almost the same numbers of jobs held by workers born in the UK or British Overseas Territories3 (63.5% in London Manufacturing, 61.3% in all London industries), similar numbers born elsewhere in the European Economic Area4 (13.3% and 12.5% respectively), and similar proportions born elsewhere in the world (23.3% and 26.2% respectively).
Similar is also true of highest educational qualifications held by job-holders in Manufacturing in London. Despite only 41% of manufacturing job-holders in London having degrees, compared with 51% in London overall, otherwise the distribution of educational qualifications in Manufacturing is similar to that of all industries overall.
However, every industry has its own staffing requirements. The Annual Population Survey tells us that, in London in 2015, Manufacturing employed workers in a wide variety of occupations, but notably a far higher propensity in Skilled Trades Occupations than most other sectors. We can see in Figure 3 that 18% of jobs in Manufacturing were in Skilled Trades Occupations in 2015, well above the London average of 7%. Construction was by far and away the industry in London with the greatest proportion (46%) of Skilled Trades workers, followed by Accommodation and Food Service Activities with almost 19%, then Manufacturing ranks third with 18%.
Figure 3: Percentage of jobs in Skilled Trades Occupations in industrial sectors in London, 2015
Source: Office for National Statistics – Annual Population Survey
Notes:
- The industrial sectors presented are based upon the UK Standard Industrial Classification (SIC) 2007, except sections A, B, D, E, S, T and U have been combined into "All other industrial sections (A,B,D,E,S,T,U)".
Download this chart Figure 3: Percentage of jobs in Skilled Trades Occupations in industrial sectors in London, 2015
Image .csv .xlsThis higher proportion of Skilled Trades Occupations, as well as a higher proportion than average in Process, Plant and Machine Operatives, and Elementary Occupations, is at the expense of lower proportions in Professional Occupations; Caring, Leisure and Other Service Occupations; and Sales and Customer Service Occupations.
Notes for Declining jobs in Manufacturing in London
Workplaces are referred to as “local units” in the Inter-Departmental Business Register.
Between 2011 and 2012, HM Revenue and Customs made improvements to their computer systems leading to previously excluded businesses being added to the IDBR. Nearly half of the increase in numbers (31,000 of 68,000 enterprises) between 2011 and 2012 at the UK level was attributable to this change. Further, in 2015, the IDBR extended the coverage of businesses to include a population of solely PAYE-based businesses that were previously excluded because of a risk of duplication. At UK level, 105,000 enterprises were added in 2015.
The British Overseas Territories include: Anguilla, Bermuda, the British Indian Ocean Territory, the British Virgin Islands, the Cayman Islands, the Falkland Islands, South Georgia, Gibraltar, Montserrat, the Pitcairn Islands, Saint Helena, the South Sandwich Islands and the Turks and Caicos Islands.
The European Economic Area (EEA) includes: Austria, Belgium, Bulgaria, Cyprus, the Czech Republic, Denmark, Estonia, Finland, France, Germany, Greece, Hungary, Iceland, the Republic of Ireland, Italy, Latvia, Liechtenstein, Lithuania, Luxembourg, Malta, the Netherlands, Norway, Poland, Portugal, Romania, Slovakia, Slovenia, Spain, Sweden and the UK. The EEA specifically excludes: Andorra, Monaco, San Marino and Vatican City. Although Iceland, Liechtenstein and Norway are not members of the European Union (EU), their citizens have the same rights as EU citizens to enter, live in and work in the UK.
4. Earnings in Manufacturing
In real terms, average (median) hourly earnings (excluding overtime) in Manufacturing in London have been falling over time, from £16.71 in 2008 to £13.94 in 2015, all in 2015 prices. This fall was also reflected in Manufacturing in the UK as a whole, falling from £13.37 to £12.69 over the same period, although as wage rates were higher in London they fell by a greater amount, as we can see in Figure 3. National Consumer Prices Index figures have been used to adjust for inflation, as data are not available at the London level, although the impact of inflation may differ in the London region compared with national figures. We should also note that earnings data for 2015 are provisional and are subject to revision.
Figure 4: Real median hourly earnings (£, excluding overtime), UK and London, 2008 to 2015
Source: Office for National Statistics – Annual Survey of Hours and Earnings (2009-2014 revised, 2015 provisional), Consumer Prices Index
Notes:
- Earnings have been adjusted for inflation using national-level Consumer Price Index figures, as no regional-level figures are available. This adjustment accounts for changes in prices over time, assuming London workers experience similar levels of inflation to the national level.
Download this chart Figure 4: Real median hourly earnings (£, excluding overtime), UK and London, 2008 to 2015
Image .csv .xlsAverage (median) hourly earnings (excluding overtime) of males according to the Annual Survey of Hours and Earnings (ASHE) in 2015 was £14.86 in Manufacturing in London, whereas for females it was £11.40. As there are relatively few Manufacturing jobs in London, the results from ASHE are unreliable for any breakdowns by sex or employment status. However, the Annual Population Survey tells us that, in 2015, 72% of jobs in Manufacturing were held by men, and 28% held by women, and also that 86% of jobs were full-time (14% part-time). We can deduce that the difference between male and female earnings in Manufacturing follows similar patterns to most industrial sectors in London.
Between 2014 and 2015, the proportion of employee jobs1 in Manufacturing earning below the London Living Wage rose from 19.3% to 23.7%, or 4.4 percentage points. The London Living Wage at the time of the survey was £8.80 in 2014 and £9.15 in 2015.
Notes for Earnings in Manufacturing
- Estimates of proportions of employees earning below minimum wage rates are calculated using the methodology recommended calculating estimates of low pay.
5. Where manufacturers are, and how they rate London
According to the Business Register and Employment Survey in 2014, the distribution of Manufacturing employees across London local authorities is illustrated in Figure 4, where we see greater concentrations in outer London than inner London, more so in the north than the south. We can also see the western boroughs of Brent, Ealing and Hillingdon have the highest concentrations of employees in Manufacturing in London, most likely because the firms are located near the major transport links of 5 motorways, the M1, M3, M4, M25 and M40, connecting them to the rest of the UK, and near Heathrow airport, connecting them internationally.
Figure 5: Number of employees in Manufacturing in London local authorities, 2015
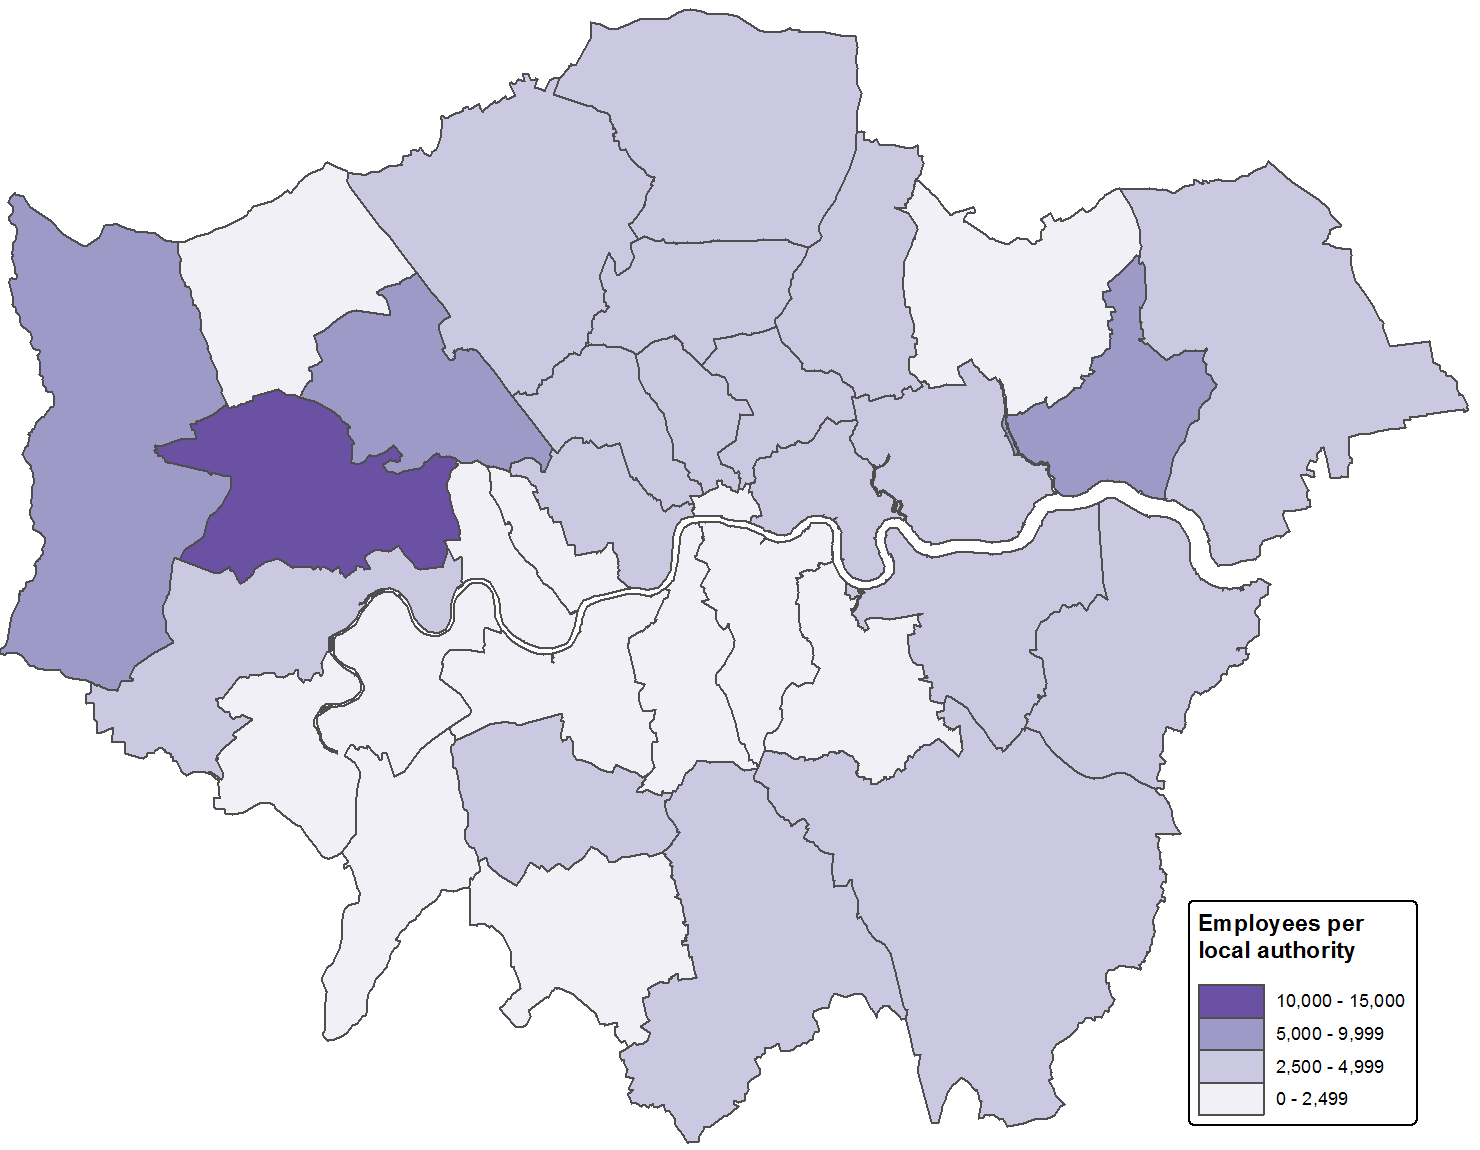
Source: Office for National Statistics – Business Register and Employment Survey
Notes:
- Contains National Statistics data © Crown copyright and database right 2016.
- Contains Ordnance Survey data © Crown copyright and database right 2016.
Download this image Figure 5: Number of employees in Manufacturing in London local authorities, 2015
.png (60.7 kB)
The 2014 London Business Survey revealed that 96% of Manufacturing workplaces in London said they were UK-owned, so only 4% were foreign-owned. However, Manufacturing workplaces were slightly unenthusiastic about having chosen to locate their business in London. When asked to rate London as a location to carry out their business on factors including having access to skilled staff, proximity to other businesses, and the transport infrastructure, manufacturers were similar to most other industries in the proportion rating it as either adequate, good or excellent. However, manufacturers were more likely to rate it adequate while most other sectors rated London good or excellent.
Further than this, a greater proportion of manufacturers rated London as poor or very poor for finding suitable and affordable workspace than almost all other industries, and about 90% of manufacturers stated that access to local amenities such as restaurants, access to cultural activities, and access to parks, sporting and recreational facilities was of slight or no importance to their business. We should note that despite being of little importance to them, 91% of Manufacturing workplaces were satisfied or very satisfied with the amenities, cultural and recreational facilities available to them.
Finally, the Annual Population Survey shows that, in 2015, 43% of Manufacturing jobs were working in scientific or technical industries according to the Science and Technology categorisation presented in Identifying Science and Technology Businesses in Official Statistics. Within Manufacturing, these jobs will have been manufacturing electrical, electronic and optical equipment; chemicals including pharmaceuticals and petroleum products; specialist machinery and specialist fabricated products; motor and transport vehicles; and repair of all these materials.
Back to table of contents