
1. Main points
The Information and Communication industry in London generated £37,639m of Gross Value Added (GVA) in 2014, which was 10.3% of London’s GVA, and 2.3% of UK GVA.
The Information and Communication sector in London has performed well in terms of jobs growth between 1996 and 2015, increasing from 247,000 to 427,000 (a 72.9% increase).
The industrial division computer programming, consultancy and related activities accounted for 60.6% of jobs growth in Information and Communication in London, and 6.8% of the increase in jobs in the whole of London, between 1996 and 2015.
Less than a fifth (18.4%) of jobs in Information Technology (computer programming, consultancy and information service activities) in London were held by women in 2015.
Job-holders in Information Technology (computer programming, consultancy and information service activities) are highly qualified, with 73.9% holding at least a degree qualification.
Back to table of contents2. Introduction
The Information and Communication industry section in London is of great importance to the UK economy. Gross Value Added (GVA) data indicate that, as of 2014, the section generated £37,639m of GVA, which was 10.3% of London’s GVA, and 2.3% of UK GVA.
The industrial sectors analysed in this article are based upon the UK Standard Industrial Classification (SIC) 2007, and within Information and Communication we will be breaking the section Information and Communication into two sub-sectors:
Publishing and Communications, which is the combination of industry divisions 58, 59, 60 and 61.
Information Technology, which is the combination of industry divisions 62 and 63.
While Information Technology concerns computer programming and IT consultancy, Publishing and Communications concerns publishing, programming, broadcasting, and telecommunications. In order to analyse London’s economy, we group industrial sections A, B, D and E to create the group “Primary and Utilities”, and split section G into two parts: “Wholesale and motor trades”, which is the combination of industrial divisions 45 and 46, and “Retail”, which is division 47. We typically exclude sections T and U from the analysis as they are too small in London to analyse effectively.
There has been strong economic growth in the section as a whole, and the two sub-sections have prospered individually, although there is interesting variation between the two, which this article aims to uncover. Essentially, the story here is a tale of two sub-sections, or at least of two distinctive halves that comprise an industry section.
This analysis is part of a series of articles entitled Earning, Learning and Business Churning: revealing London's industrial economy, which analyse patterns of activity in industries in London. Data used in this analysis has been used to create the Economic Evidence Base by the Greater London Authority, which forms the economic basis of the Mayor of London’s London Plan. This article gives detail about a particular industrial sector, whereas the Economic Evidence Base provides a more comprehensive understanding of London’s economy.
Back to table of contents3. Jobs in Information and Communication
Workforce Jobs data in Figure 1 show that the Information and Communication industry section in London has performed well in terms of jobs growth over the past twenty years. The number of jobs has increased from 247,000 to 427,000 in London – an increase of 72.9% – between 1996 and 2015. The Information and Communication sector experienced the fifth-highest percentage change in jobs over this period compared to the other 16 industrial sectors1.
Figure 1: Change in number of jobs in selected industry sections in London, 1996 to 2015
Source: Workforce Jobs estimates, Office for National Statistics
Notes:
- The sectors of highest growth (Professional, Scientific and Technical Activities) and lowest growth (Manufacturing) in London are also shown to give context.
Download this chart Figure 1: Change in number of jobs in selected industry sections in London, 1996 to 2015
Image .csv .xlsFigure 2 breaks the Information and Communication industry section down into two sub-sections. High growth levels in Information Technology meant that this sub-section accounted for 48.5% of the jobs in Information and Communication in London in 2015, up from 36.8% in 1996. Information Technology in London has more than doubled in terms of jobs, from 91,000 to 206,000 between 1996 and 2015.
Figure 2: Jobs growth by sub-sections of Information and Communication in London, 1996 to 2015
Source: Workforce Jobs estimates, Office for National Statistics
Notes:
The categories presented are based upon the UK Standard Industrial Classification (SIC) 2007. Publishing and Communications is the combination of industrial divisions 58, 59, 60 and 61, and Information Technology is the combination of industrial divisions 62 and 63.
Download this chart Figure 2: Jobs growth by sub-sections of Information and Communication in London, 1996 to 2015
Image .csv .xlsThe sub-section Publishing and Communications has also grown, but not at the same pace as Information Technology. Jobs in this sub-section in London increased from 156,000 in 1996 to 219,000 in 2015, an increase of 40.4%.
With the Workforce Jobs data we can go even further, breaking down each sub-section into its constituent divisions, as in Figure 3. By doing so we reveal that the growth of one individual division: computer programming, consultancy and related activities, outshines that of the other divisions of Information and Communication.
Figure 3: Change in number of jobs in divisions of Information and Communication in London, 1996 to 2015
Source: Workforce Jobs estimates
Download this chart Figure 3: Change in number of jobs in divisions of Information and Communication in London, 1996 to 2015
Image .csv .xlsThe division computer programming, consultancy and related activities, therefore, has accounted for much of the section’s growth in jobs in London over the past two decades. In fact, the division accounted for 95.8% of job growth in the Information Technology sub-section, 60.6% of jobs growth in Information and Communication, and 6.8% of the increase in jobs in the whole of London between 1996 and 2015.
Notes for Jobs in Information and Communication
- As explained in the introduction, industrial sections A, B, D and E are combined into one industrial grouping, section G is split into two sectors, and sections T and U are excluded, meaning we typically analyse 17 industrial sectors of London’s economy.
4. Locating employment in Information and Communication
We have so far established that the two sub-sections within Information and Communication – Information Technology, and Publishing and Communications – exhibit some quite different characteristics in their rates of job growth.
Figure 4, based on data from the Business Register and Employment Survey, shows that the number of employees in Information Technology workplaces in 2015 were concentrated in inner London, especially in The City, Tower Hamlets, Camden, Islington and Westminster. Some other Local Authorities, particularly western and southern London, do also have concentrations of Information Technology employees, while the north and east of London has the lowest concentrations.
Figure 4: Number of employees in Information Technology in London Local Authorities, 2015

Source: Business Register and Employment Survey
Notes:
The categories presented are based upon the UK Standard Industrial Classification (SIC) 2007. Publishing and Communications is the combination of industrial divisions 58, 59, 60 and 61, and Information Technology is the combination of industrial divisions 62 and 63.
Contains National Statistics data © Crown copyright and database right 2016.
Contains Ordnance Survey data © Crown copyright and database right 2016.
Download this image Figure 4: Number of employees in Information Technology in London Local Authorities, 2015
.png (58.8 kB)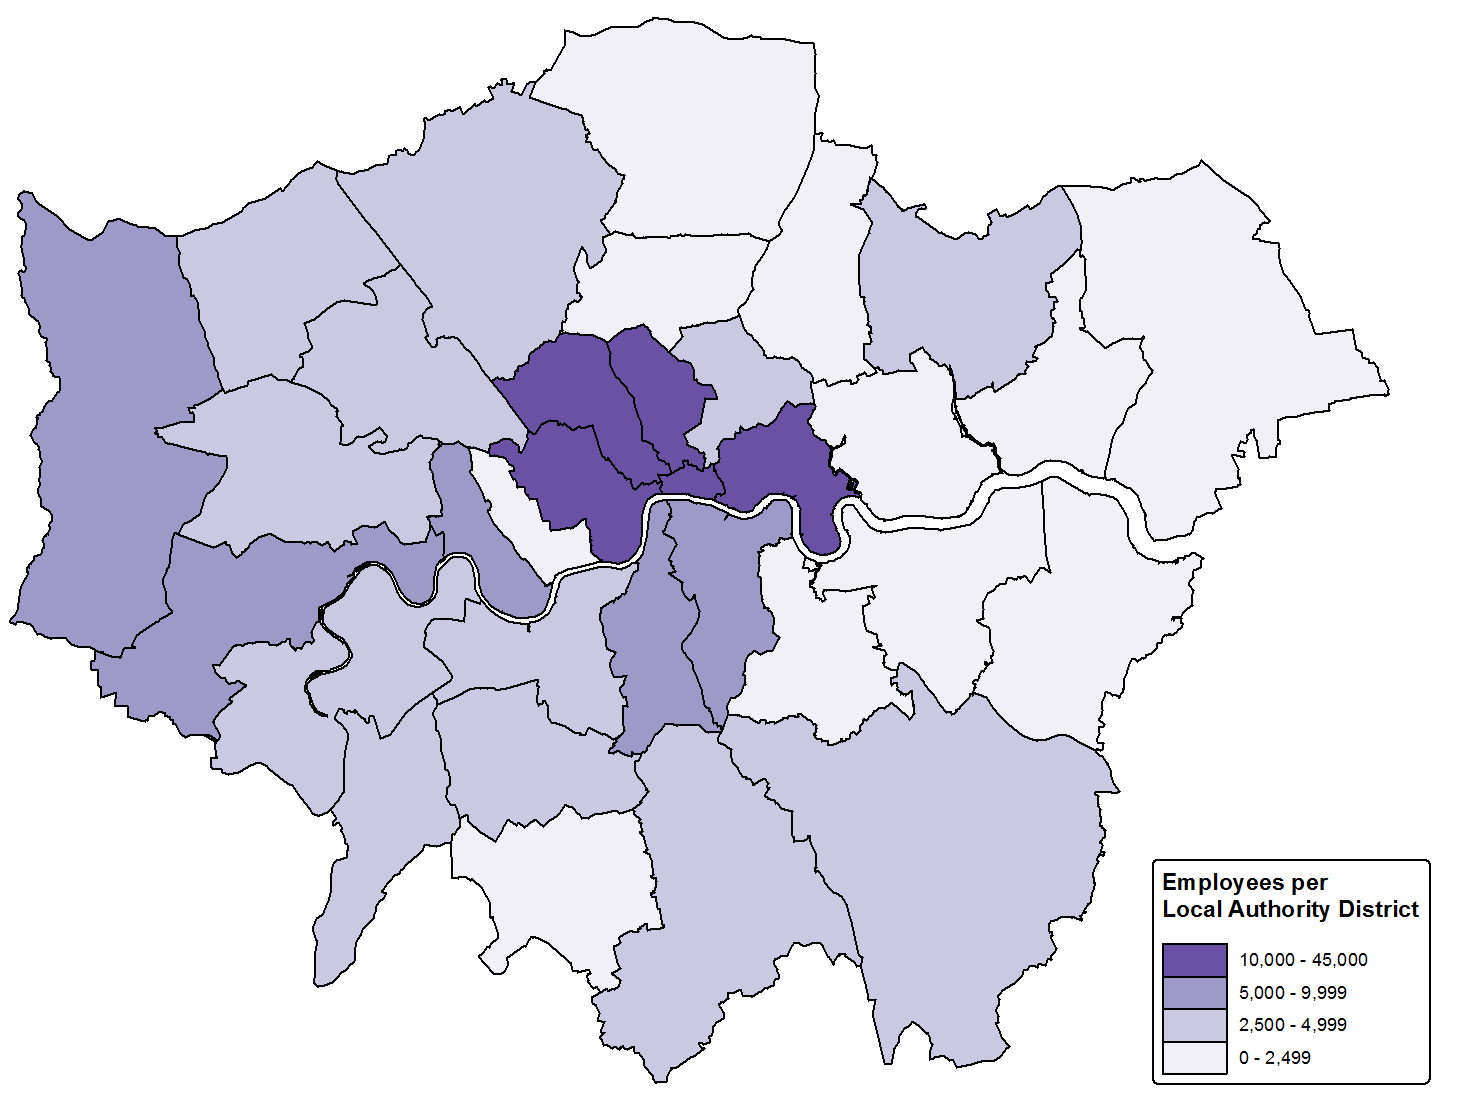
There are some similarities for Publishing and Communications, with a concentration of jobs in central London in 2015, as depicted in Figure 5. That said, there are clear differences too, with Publishing and Communications employees concentrated in fewer authorities; there are 18 authorities with fewer than 2,500 employees in the sub-section. Overall, employment in Information Technology is more dispersed across the capital.
Figure 5: Number of employees in Publishing and Communications in London Local Authorities, 2015

Source: Business Register and Employment Survey
Notes:
The categories presented are based upon the UK Standard Industrial Classification (SIC) 2007. Publishing and Communications is the combination of industrial divisions 58, 59, 60 and 61, and Information Technology is the combination of industrial divisions 62 and 63.
Contains National Statistics data © Crown copyright and database right 2016.
Contains Ordnance Survey data © Crown copyright and database right 2016.
Download this image Figure 5: Number of employees in Publishing and Communications in London Local Authorities, 2015
.png (59.0 kB)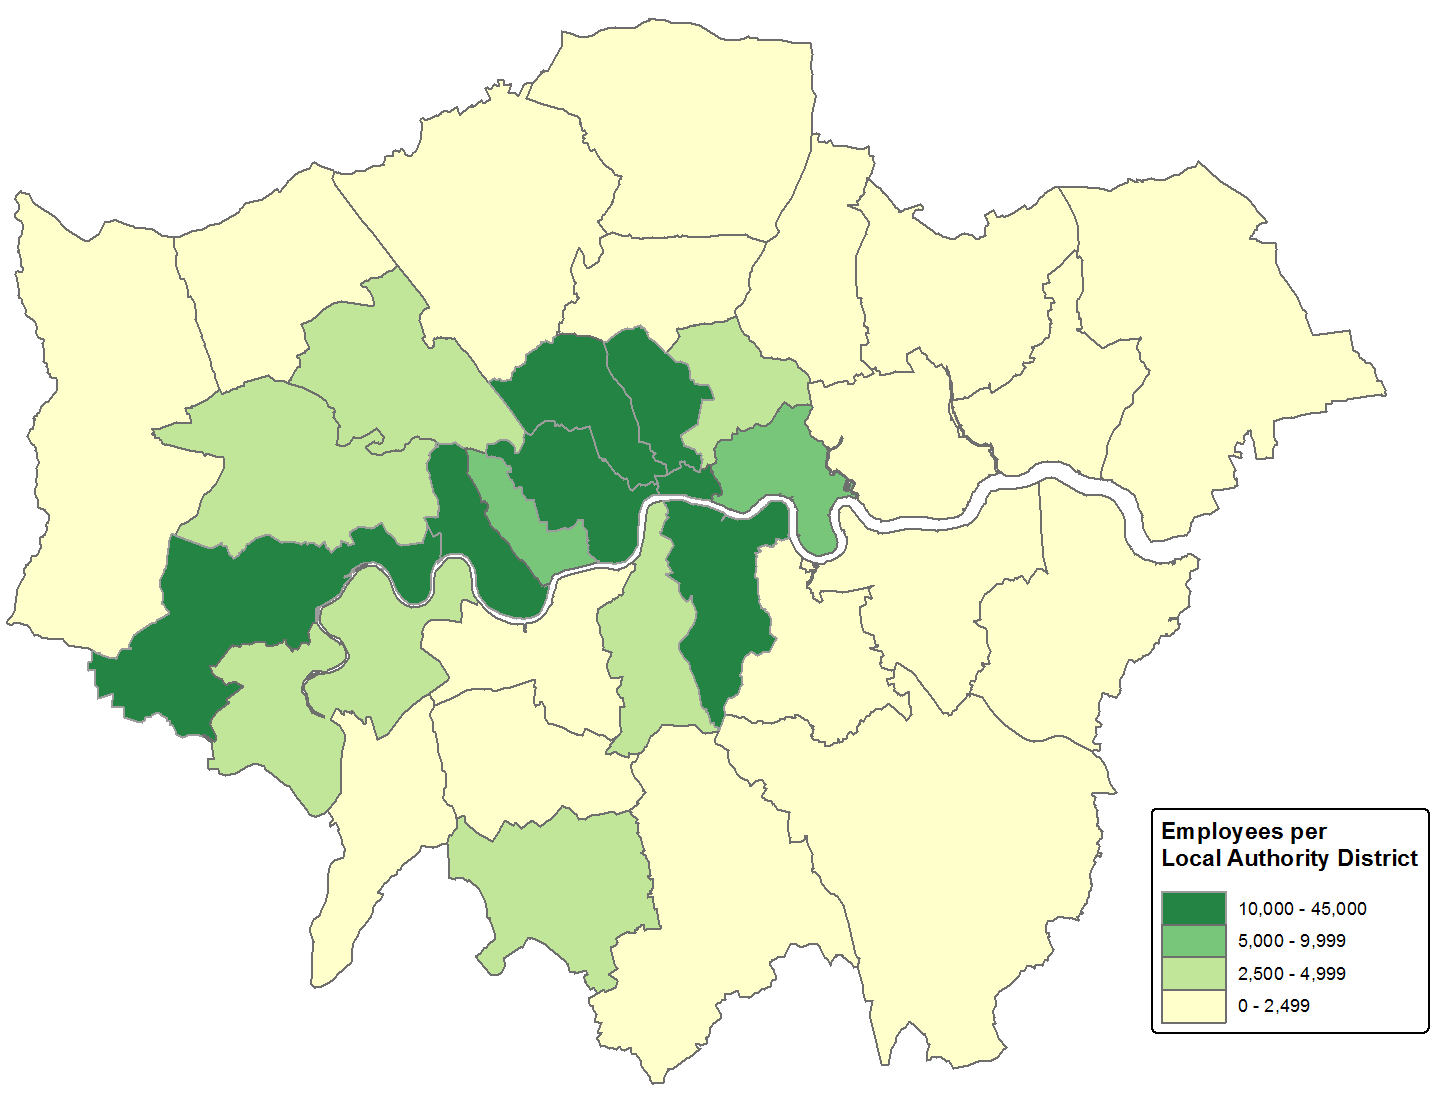
5. A tale of two workforces
The Annual Population Survey provides us with data to look at workforce characteristics. The section as a whole in London featured low female employment, with women holding 28.8% of the 427,000 jobs in 2015, as shown in Figure 6.
Figure 6: Jobs in Information and Communication by sex of job-holder, London, 2015
Total jobs: 427,000
Source: Workforce Jobs and Annual Population Survey
Download this chart Figure 6: Jobs in Information and Communication by sex of job-holder, London, 2015
Image .csv .xlsBreaking this down to the sub-sections Information Technology and Publishing and Communications reveals that the gender imbalance in employment is much starker in the former than the latter. As shown in Figure 7, in Information Technology, less than a fifth (18.4%) of jobs in London were held by women in 2015. Publishing and Communications was less unbalanced, with women making up 38.9% of the workforce. This is, however, still less than the figure for all industries in London (44.5%).
Figure 7: Employment in sub-sections of Information and Communication, by sex of job-holder in London, 2015
Source: Annual Population Survey
Notes:
- The categories presented are based upon the UK Standard Industrial Classification (SIC) 2007. Publishing and Communications is the combination of industrial divisions 58, 59, 60 and 61, and Information Technology is the combination of industrial divisions 62 and 63.
Download this chart Figure 7: Employment in sub-sections of Information and Communication, by sex of job-holder in London, 2015
Image .csv .xlsAnother notable feature of the Information and Communication workforce is its high level of educational qualifications, with 72.4% of jobs in London in 2015 held by people possessing at least a degree, compared to 50.8% for all other industries in London. This is shown in Figure 8.
Figure 8: Information and Communication jobs by highest qualification of job-holder, London, 2015
Source: Annual Population Survey
Notes:
- The highest educational qualifications follow the standard ONS categories, except the top category "Degree or equivalent" has been split to show "Higher degree" and "Ordinary degree or equivalent" separately. Further information on these categories is available in the Labour Force Survey (LFS) User Guide.
Download this chart Figure 8: Information and Communication jobs by highest qualification of job-holder, London, 2015
Image .csv .xlsThe data do not indicate marked differences in education between the two sub-sections, with both exhibiting high levels of education in London in 2015: 70.8% of job-holders in Publishing and Communications, and 73.9% of job-holders in Information Technology, held at least a degree. A small difference does exist at the upper end of the education scale, with just under one-quarter of those in Information Technology (24.6%) holding a higher degree, compared to just under one-fifth of those in Publishing and Communications (18.8%), in London in 2015.
Figure 9: Employment in Information and Communication in London by country of birth of job-holder, 2015
Source: Annual Population Survey
Notes:
The categories presented are based upon the UK Standard Industrial Classification (SIC) 2007. Publishing and Communications is the combination of industrial divisions 58, 59, 60 and 61, and Information Technology is the combination of industrial divisions 62 and 63.
The British Overseas Territories include: Anguilla, Bermuda, the British Indian Ocean Territory, the British Virgin Islands, the Cayman Islands, the Falkland Islands, South Georgia, Gibraltar, Montserrat, the Pitcairn Islands, Saint Helena, the South Sandwich Islands and the Turks and Caicos Islands.
The European Economic Area (EEA) includes: Austria, Belgium, Bulgaria, Cyprus, the Czech Republic, Denmark, Estonia, Finland, France, Germany, Greece, Hungary, Iceland, the Republic of Ireland, Italy, Latvia, Liechtenstein, Lithuania, Luxembourg, Malta, the Netherlands, Norway, Poland, Portugal, Romania, Slovakia, Slovenia, Spain, Sweden and the UK. The EEA specifically excludes: Andorra, Monaco, San Marino and Vatican City. Although Iceland, Liechtenstein and Norway are not members of the European Union (EU), their citizens have the same rights as EU citizens to enter, live in and work in the UK.
Download this chart Figure 9: Employment in Information and Communication in London by country of birth of job-holder, 2015
Image .csv .xlsFinally, there are differences in terms of country of birth. In Information Technology, 44.0% of job-holders in London were born outside the UK or British Overseas Territories1. The corresponding figure for Publishing and Communications is 25.3%, compared to 38.7% in all industries.
Notes for A tale of two workforces
- The British Overseas Territories include: Anguilla, Bermuda, the British Indian Ocean Territory, the British Virgin Islands, the Cayman Islands, the Falkland Islands, South Georgia, Gibraltar, Montserrat, the Pitcairn Islands, Saint Helena, the South Sandwich Islands and the Turks and Caicos Islands.
6. Earnings in the sub-sections
Results from the 2015 provisional Annual Survey of Hours and Earnings (ASHE) indicate that in London, Information Technology earnings were higher than those in Publishing and Communications, and this applied to the lowest 25% of earners, the average (median) and the upper 25% of earners. This can be seen in Figure 10. Note that data for 2015 are provisional and are subject to revision.
Figure 10: Information and Communication earnings in London, 2015
Source: Annual Survey of Hours and Earnings (2015, provisional)
Notes:
The categories presented are based upon the UK Standard Industrial Classification (SIC) 2007. Publishing and Communications is the combination of industrial divisions 58, 59, 60 and 61, and Information Technology is the combination of industrial divisions 62 and 63.
To aid in interpretation of the chart, the 50th percentile is the point below which 50% of workers in the income distribution lie, and represents average (median) earnings. The 75th percentile represents the top 25% of earners, and the 25th percentile represents the lowest 25% of earners.
Download this chart Figure 10: Information and Communication earnings in London, 2015
Image .csv .xlsAverage (median) hourly earnings (excluding overtime) in London in 2015 for Information Technology were £21.05, whilst the figure for Publishing and Communications was £19.22, and £15.74 for the London average. In other words, London employees in Information Technology were paid £5.31 (33.7%) more per hour than the London average, and those in Publishing and Communications were paid £3.48 (22.1%) more. Only 4.0% of employees in Information and Communication in 2015 were earning below the London Living Wage1, which was £9.15 at the time ASHE was collected.
Earnings data can be broken down by sex, too, which enables examination of the gender pay gap2. There is no single measure that adequately deals with the complex issue of the differences between men’s and women’s pay, issues including differences in occupations, working patterns and age distributions. We have calculated the gender pay gap using the same methodology as explained in Annual Survey of Hours and Earnings: 2015 Provisional Results, using median hourly earnings (excluding overtime), and it should be noted that the figures do not show differences in rates of pay for comparable jobs.
Once again, there is a clear difference between the two sub-sections. In 2015 there was a larger gender pay gap in London in Information Technology (23.8%) than in Publishing and Communications (12.9%).
Notes for Earnings in the sub-sections
Estimates of proportions of employees earning below minimum wage rates are calculated using the methodology recommended calculating estimates of low pay.
The gender pay gap refers to the percentage difference between male and female hourly earnings. The calculation is: 100 – (female hourly pay / male hourly pay) x 100.