Table of contents
1. Main points
There were provisionally 490,705 deaths registered in 2016; this is 4,604 fewer than in 2015, but 21,828 more than in 2014, and 19,229 more than the average over the period 2011 to 2015.
The death rate in 2016 was the second lowest since 2001 (based on death rates adjusted for changes in the age structure of the population), despite 2016 having the fifth-highest number of deaths over that period.
For both genders, life expectancy for 2016 was higher than 2015, and for men was back to the historically high values of 2014.
Additional deaths in 2016 (when compared with the 2011 to 2015 average) can be accounted for by changes in the size and structure of the population; if the population in 2016 had experienced the same average mortality rates as 2011 to 2015, we would have expected approximately 10,000 more deaths than were actually registered.
Looking at those aged 75 and over the death rate has fallen for each group when compared with 2001, for those aged 75 to 79 in particular it has fallen by almost a third; however, most of the fall was up to 2011 and there has been little change since then.
2. Introduction
This is the first in a planned series of quarterly releases providing timely information on mortality patterns in England. These will report on deaths shortly after the end of the time period to provide the most up-to-date national analysis of recent trends.
The majority of the analyses reported here are based on a provisional extract of deaths that occurred in or were registered in 2016; future reports will focus on the most recent quarter. This provides the best available data to allow timely reporting of recent mortality trends. The technical notes at the end of the report provide detail on the data sources used.
This publication was produced with support from Public Health England. Provisional life expectancy estimates were produced by Public Health England.
More details on methods and data sources used can be found in the Background information section
Back to table of contents3. Death registrations
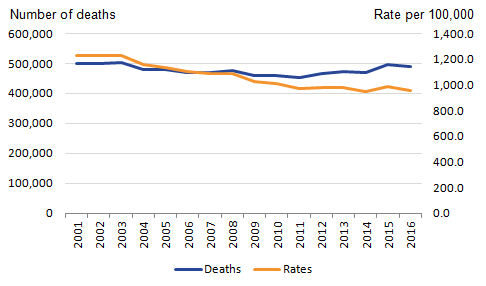
Figure 1: Number of deaths registered (left axis) and age standardised death rates (right axis), England, 2001 to 20161
Source: Office for national statistics
Notes:
- Data for 2016 is provisional
Download this image Figure 1: Number of deaths registered (left axis) and age standardised death rates (right axis), England, 2001 to 2016^1^
.png (7.5 kB) .xls (26.1 kB)
There were 490,705 deaths registered in 2016. This was 4,604 fewer than in 2015 but 21,828 more than in 2014 and 19,229 more than the average of the previous 5 years. The long-term trend in the number of deaths was generally downwards until 2011, but it appears that since then there has been a change in the trend. The number of deaths has been higher than in 2011 in each of the five subsequent years, with year-on-year increases in 2012, 2013 and 2015. As the population ages we might expect to see an increase in the number of deaths so for this reason it is important to examine the number of deaths in the context of mortality rates.
Age-standardised mortality rates are a better measure of the level of mortality than simply looking at the number of deaths, as they take into account the population size, its age structure and the age distribution of deaths. There may be 2 years which have a similar total number of deaths, but have very different age-standardised mortality rates.
The age-standardised death rate in 2016 was 958.0 deaths for every 100,000 people in the population, compared with 986.6 in 2015. Despite the number of deaths generally increasing since 2011, the age-standardised death rate has generally been relatively stable. For example, 2016 had the second-highest number of deaths in the period 2011 to 2016 but also had the second-lowest age-standardised death rate.
Table 1 looks at the expected number of deaths for the 2016 population if the death rate was the same as previous years.
Table 1: Expected number of deaths, England, 2016
| 2016 | 2011 | 2012 | 2013 | 2014 | 2015 | Average of years 2011 to 2015 | ||||||||
| Number of deaths | 490,705 | 452,863 | 466,780 | 473,550 | 468,877 | 495,309 | 471,476 | |||||||
| Difference compared with 2016 deaths | -37,842 | -23,925 | -17,155 | -21,828 | 4,604 | -19,229 | ||||||||
| Expected number of deaths in 2016 using each year's mortality rate | 499,600 | 504,807 | 503,648 | 486,659 | 506,425 | 500,333 | ||||||||
| Difference in 2016 expected number of deaths compared with 2016 observed number of deaths | 8,895 | 14,102 | 12,943 | -4,046 | 15,720 | 9,628 | ||||||||
| Source: Office for National Statistics | ||||||||||||||
Download this table Table 1: Expected number of deaths, England, 2016
.xls (27.6 kB)Even though Table 1 shows that 2016 had a higher number of deaths compared with all years apart from 2015, if the mortality rate for each year is applied to the 2016 population we would have expected a higher number of deaths registered in 2016 than 490,705 (apart from 2014). Specifically, all of the excess deaths in 2016 (when compared with the average for 2011 to 2015) could be explained by changes in the size and structure of the population. If the population in 2016 had experienced the same average mortality rates as 2011 to 2015, we would have expected almost 10,000 more deaths than were actually registered. More information on the method used can be found in the background notes.
Figure 2: Life expectancy at birth, by sex, England, 2005 to 20161
Source: Office for National Statistics and Public Health England
Notes:
- Data for 2016 is provisional.
Download this chart Figure 2: Life expectancy at birth, by sex, England, 2005 to 2016^1^
Image .csv .xlsFor males, life expectancy at birth in 2016 was the same as the historically high value in 2014 of 79.5 years, and for females it rose in 2016 compared with 2015 to 83.1 years, and was higher than all years other than 2014. The increase from 2015 for both sexes was 0.2 years between 2015 and 2016 for both males and females.
The accompanying tables show life expectancy at birth, age 65, 75, 85 and 95 by sex.
The difference in life expectancy by gender decreases as age increases. At birth, females were expected to live 3.6 years longer than males, at age 95 it decreased to a difference of 0.3 years.
Back to table of contents4. Death occurrences
Most reports we publish focus on the number of deaths registered within a period rather than the number of deaths that occurred within a period. This is due to issues around registration delays. For future editions of this output, the analysis will be based mainly on death occurrences rather than registrations to help monitor emerging trends in mortality.
Figure 3: Number of death registrations and occurrences, England, 2001 to 20161
Source: Office for National Statistics
Notes:
- Data for 2016 is provisional.
Download this chart Figure 3: Number of death registrations and occurrences, England, 2001 to 2016^1^
Image .csv .xlsMany users are interested in looking at when deaths occurred rather than registered because there can be registration delays, which impacts on comparisons between one period and another. This is more evident when looking at specific causes of death, in particular those that often go to inquest. For example, in Wales between 2012 and 2013, the number of registered suicides went up but the occurrences over the same period went down. Therefore it is important when looking at patterns among deaths to consider both sets of statistics.
However, at the time of this analysis not all deaths that occurred in 2016 will have been registered and throughout 2017 additional deaths that occurred in 2016 will continue to be registered as inquests complete. The Office for National Statistics (ONS) only receives notification of a death when the death is registered, and a death which has been referred to a coroner would usually only be registered after the inquest has been held. We estimate that as of 2 February, when the extract of deaths was taken for this analysis, we have captured around 98% of the deaths that occurred in 2016. This is estimated looking at patterns for previous years.
The difference in the number of deaths registered within a year and the number of deaths that occurred within a year for the years 2001 to 2016 is shown in Figure 3. The difference in the number of deaths between registrations and occurrences ranges between 14 (in 2012) and 4,227 (in 2015). In 2016, the difference between the number of death registrations and death occurrences was 7,915 but we would expect this number to decrease as more deaths that occurred in 2016 get registered. The analysis in the rest of the report is based on deaths occurring in a year, rather than registered in a year. To overcome the problem of not having all of the data for 2016 we have done some additional analysis comparing 2016 with data for previous years that has been extracted at a similar time point – we have considered deaths that occurred in those years and had been registered by early February.
Figure 4: Number of deaths occurring, 2001 to 20161
Source: Office for National Statistics
Notes:
- Data for 2016 is provisional.
Download this chart Figure 4: Number of deaths occurring, 2001 to 2016^1^
Image .csv .xlsIf we take the occurrences registered up to a date similar to the 2016 deadline for the previous years, we can see that the death occurrences in 2016 are similar to that in 2015. We can expect that the number of deaths occurring in 2016 to rise by between 5,300 and 9,700 deaths when late registrations are accounted for. Until these late registrations are accounted for, we do not know if the number of deaths occurring in 2016 will be higher than those occurring in 2015.
Figure 5: Percentage of deaths captured by age group, 2014 and 20151
Source: Office for National Statistics
Notes:
- Percentage captured is the proportion of deaths that occurred in each year and were registered by a similar extraction date to the 2016 extraction (early February).
Download this chart Figure 5: Percentage of deaths captured by age group, 2014 and 2015^1^
Image .csv .xlsWhile not all deaths that occurred have been registered yet this mainly affects younger age groups in which a death is more likely to go to inquest as shown in Figure 5. Older ages tend to have a high percentage of deaths captured, but looking at the previous 2 years, between 72% and 89% of deaths were captured in younger age groups such as 15 to 19 through to 40 to 44. The next section of analysis focuses on the older age groups, where we estimate that we have most of the deaths that have occurred.
Figure 6: Difference in mortality rates compared with 2001, 75 and over, 2002 to 20161
Source: Office for National Statistics
Notes:
- Data for 2016 is provisional.
Download this chart Figure 6: Difference in mortality rates compared with 2001, 75 and over, 2002 to 2016^1^
Image .csv .xlsLooking at the oldest ages, the death rate in the age group 75 to 79 has fallen the most since 2001 with over a 30% decrease. However, most of the fall took place up to 2011 and there has been little change since then. The percentage difference between 2001 and 2016 is smaller at the oldest age groups and fluctuates more, especially in those aged 90 and over. The smallest change can be seen in the 90 and over age group which has seen a 6.5% fall in rates compared with 2001. Also, as it is an open-ended age group, it is not adjusted for changes in the age structure of this group, as illustrated in Figure 7. Within the 90 and over age group, there was a higher percentage of people aged 90, 91 and 92 in 2001 than 2016, but at age 93 and older, there was a higher percentage in 2016. This indicates that by 2016, the age structure of the population aged 90 and over was older than it had been in 2001.
Figure 7: Population breakdown of those aged 90 and over, 2001 and 20161,2
Source: Office for National Statistics
Notes:
- 2016 populations are based on 2014 projections
- We publish 2001 populations.
Download this chart Figure 7: Population breakdown of those aged 90 and over, 2001 and 2016^1,2^
Image .csv .xls
Figure 8: Mortality rates by single year of age, ages 75 and over, 2014 to 20161
Source: Office for National Statistics
Notes:
- Data for 2016 is provisional.
Download this chart Figure 8: Mortality rates by single year of age, ages 75 and over, 2014 to 20161
Image .csv .xlsEven within age groups there is a difference in the death rates when breaking down into single year of age. As age increases, so do the death rates. Death rates at each age are between 7% and 23% higher than the previous age. The exceptions are those aged 95 in 2014, 96 in 2015 and 97 in 2016, whose rates are lower than the previous age.
Figure 9: Death occurrences (all ages) by day, 2016, 2015 and 2011 to 2015 average1
Source: Office for National Statistics
Notes:
- Data for 2016 is provisional.
Download this chart Figure 9: Death occurrences (all ages) by day, 2016, 2015 and 2011 to 2015 average^1^
Image .csv .xlsFor most of 2016, the number of deaths occurring each day was higher than the average for 2011 to 2015, with 258 of the 366 days being higher than the 5-year average. In 2016, 1 January had the biggest negative difference compared with the 5-year average with 227 fewer deaths. As can be seen in Figure 9, this is driven by 2015 having a high number of deaths compared with the 2011 to 2015 average. The days with the highest positive differences were 19 and 20 July with 341 and 319 more deaths, respectively. The high number of deaths in July coincides with a spike in temperature. More information on the link between temperature and deaths can be found in the Excess Winter Mortality report.
Back to table of contents5. Background information
Data sources
A provisional extract of death registrations and death occurrences in 2016 was created roughly 4 weeks after the end of the reporting period. For this reason, we would expect deaths to increase, especially in the occurrence dataset where any late registrations will not have been accounted for. We anticipate small changes to registrations. Data for years prior to 2016 is not provisional.
We publish the population estimates used for calculating rates. For 2016, the ONS population projections were used. Care should be taken when using the 2014 population projections as they will not take into account the high deaths in 2015; 2016 population estimates will be published in June.
For single year of age populations of older ages, we used the Mid-year population estimates of the very old publication, and for 2001 we use population Estimates for ages 90 and over.
Registration delays on occurrences
As previously stated, the occurrences dataset will not hold all deaths in 2016 due to late registrations. We have estimated that we have around 98% of the deaths in 2016. To do this we took the final data for each year from 2001 to 2015 and calculated the proportion of deaths that were registered by a similar 4-week cut-off date.
Expected deaths methodology
For each respective year the single year of age mortality rates were calculated. This was then applied to the population projections for 2016 to calculate the number of expected deaths in each single year of age using the mortality rate from the respective year. From this we were able to calculate the difference between observed and expected deaths in 2016.
Back to table of contents