
1. Main points
- As exposure to area deprivation increases, the risk of avoidable death grows in England and Wales.
- Since 2001, mortality rates in the most deprived areas have remained substantially higher than the least deprived areas in both England and Wales.
- In England and Wales, mortality rates from cardiovascular diseases have significantly decreased since 2001 for those living in the most deprived areas; however, the largest declines over time were observed in the least deprived populations ranging from 60% to 73%.
- Mortality rates for respiratory diseases have increased since 2001 in England and Wales for those living in the most deprived areas; the largest increases were observed in Wales of 60% for males and 63% for females.
- In Wales, 351.9 deaths per 100,000 males and 234.6 deaths per 100,000 females could have been avoided had mortality rates in the least deprived areas prevailed in the most deprived areas; similar figures were also observed in England.
- In England in 2016, males and females living in the most deprived areas were 4.5 times and 3.9 times more likely to die from an avoidable cause than those in the least deprived areas.
2. Statistician’s comment
“Overall avoidable mortality rates have improved over the last 16 years for both England and Wales. However, avoidable mortality rates in the most deprived areas have not improved as quickly as those in the least deprived areas. This could be because these areas have not benefitted as much from improvements in mortality from cardiovascular and respiratory diseases.”
Melissa Bennett, Health Analysis and Life Events, Office for National Statistics
Back to table of contents3. Things you need to know about this release
What data are in this release?
This article looks at the socioeconomic inequalities in avoidable mortality in England and Wales from 2001 to 2016. The analysis uses age-standardised avoidable mortality rates by deprivation decile, sex and cause as well as absolute (slope index of inequality) and relative (relative index of inequality) measures of inequality.
What is avoidable mortality?
Avoidable mortality refers to deaths from causes that are considered avoidable in the presence of timely and effective healthcare or public health interventions. For most of the causes of death included in our definition there is an upper age limit of 74 years. While a particular cause of death can be considered avoidable in principle, this doesn’t mean that every death from that cause could have been averted.
Overall avoidable mortality can be divided into two sub-categories, ‘amenable to healthcare’ and ‘preventable’. In instances where a cause can be both amenable and preventable, deaths are only counted once in the overall avoidable mortality figure.
There was a change from 2014 onwards in the lists of causes of death included in the avoidable mortality definitions. The number of deaths increased slightly compared with the previous definition, but there was no statistically significant change in the mortality rates. Both definitions can be found in the accompanying datasets and more information is in the quality and methodology section.
How has socioeconomic deprivation been measured?
Socioeconomic deprivation is measured using the Index of Multiple Deprivation (IMD), which provides an overall relative measure of deprivation for each lower layer super output area (LSOA). An LSOA is a small area with an average population of 1,500 people. The overall IMD scores are ranked for all LSOAs within a country and can be divided into 10 groups (deciles) where decile 1 represents the most deprived LSOAs and decile 10 represents the least deprived LSOAs. The IMD is a score based on the area as a whole and not everyone within an LSOA necessarily experiences the same level or type of deprivation.
This article focuses on the two extremes (decile 1 and decile 10); however, data for all deciles are available in the accompanying datasets. There is more information in the quality and methodology section on the IMD measures and how they were used.
Update: 29 October 2018
In the compilation of avoidable mortality statistics, we have sought the views of government bodies regarding their usefulness for policy and service delivery. Considering the views assembled, we extended the coverage of the avoidable mortality publications to Scotland and Northern Ireland to enable a UK measure to be estimated. We also extended these measures to sub-national areas of England and Wales, including health bodies, to identify specific parts of England and Wales with higher than average avoidable deaths, and to area deprivation groupings to estimate the trend in the socioeconomic inequality.
We provide early access for quality assurance to a small number of people working in other government bodies. This is to acknowledge use of mortality data we do not own, in the case of Scotland and Northern Ireland, and for general comment on the plausibility of our findings. However, ONS itself independently produces these statistics, including determining the focus, content, commentary, illustration and interpretation of these measures presented in bulletins.
Update: 16 January 2019
We would like to clarify that our definition of avoidable mortality is different to the measure of avoidable deaths in hospital NHS trusts are required to publish figures on. We use a defined set of underlying causes of death that have been approved through consultation with users and expert guidance. It includes conditions where it is reasonable to expect deaths to be avoided through good quality healthcare, even after the condition has developed (amenable mortality), as well as those where it is possible to prevent the condition from occurring in the first place (incidence reduction) through wider public health interventions, such as those targeted at reducing the incidence of smoking (preventable mortality). The avoidable deaths in hospital measure is based on a record review of a sample of deaths deemed to be due to problems in care. Avoidable deaths in hospital data are not intended to be comparable and are not collated centrally.
Back to table of contents4. Relationship between avoidable mortality and deprivation in England
Avoidable mortality rates consistently highest in the most deprived local areas in England
From 2001 to 2013, the average avoidable mortality rates for males in England fell significantly with a decrease of 32% (from 403.6 to 274.5 deaths per 100,000) (Figure 1). Mortality rates for the least deprived tenth of local areas (decile 10) declined in line with the England average with a decrease of 33% (from 248.4 to 167.2 deaths per 100,000); a smaller but still significant decline of 28% (from 705.0 to 504.2 deaths per 100,000) was observed in the most deprived tenth of areas (decile 1).
Between 2014 and 2016, avoidable mortality rates for males in the most and least deprived areas as well as the England average all decreased but this change was not significant.
Figure 1: Age-standardised avoidable mortality rates for males
England, 2001 to 2016
Source: Office for National Statistics
Notes:
- Data years 2001 to 2013 and 2014 to 2016 are based on different avoidable mortality definitions. As a result, the data for these years are not directly comparable.
- Figures are for deaths registered in each calendar year.
- Figures for England exclude deaths of non-residents.
- Age-standardised mortality rates are expressed per 100,000 population and standardised to the 2013 European Standard Population. Age-standardised mortality rates are used to allow comparison between populations which may contain different proportions of people of different ages.
- Deprivation deciles are based on the Index of Multiple Deprivation (IMD) which is the official measure of relative deprivation. IMD 2004 was used for the data years 2001 to 2005, IMD 2007 was used for years 2006 to 2008, IMD 2010 was used for years 2009 to 2013 and IMD 2015 was used for years 2014 to 2016.
- Decile 1 represents the most deprived and decile 10 represents the least deprived.
Download this chart Figure 1: Age-standardised avoidable mortality rates for males
Image .csv .xlsThe avoidable mortality rates for females in decile 1 (most deprived areas), decile 10 (least deprived areas) and the England average all significantly decreased from 2001 to 2013 (Figure 2). However, the decreases were less than for males, with a 22% decrease in the most deprived areas (from 388.1 to 301.8 deaths per 100,000), a 30% decrease in the least deprived (from 152.5 to 107.2 deaths per 100,000) and a 28% decrease in the England average (from 232.0 to 166.7 deaths per 100,000).
From 2014 to 2016 a non-significant increase in mortality rates was observed for females in the most deprived areas and in the England average, compared with the least deprived areas where a non-significant decrease in mortality rates was observed.
Figure 2: Age-standardised avoidable mortality rates for females
England, 2001 to 2016
Source: Office for National Statistics
Notes:
- Data years 2001 to 2013 and 2014 to 2016 are based on different avoidable mortality definitions. As a result, the data for these years are not directly comparable.
- Figures are for deaths registered in each calendar year.
- Figures for England exclude deaths of non-residents.
- Age-standardised mortality rates are expressed per 100,000 population and standardised to the 2013 European Standard Population. Age-standardised mortality rates are used to allow comparison between populations which may contain different proportions of people of different ages.
- Deprivation deciles are based on the Index of Multiple Deprivation (IMD) which is the official measure of relative deprivation. IMD 2004 was used for the data years 2001 to 2005, IMD 2007 was used for years 2006 to 2008, IMD 2010 was used for years 2009 to 2013 and IMD 2015 was used for years 2014 to 2016.
- Decile 1 represents the most deprived and decile 10 represents the least deprived.
Download this chart Figure 2: Age-standardised avoidable mortality rates for females
Image .csv .xlsThe overall time-trend observed in male and female avoidable mortality rates for England is in line with recent findings showing a greater rate of improvement in mortality between 1990 and 2011 with a slowing-down of improvement around the early 2010s.
Largest decreases in deaths from avoidable cardiovascular diseases in least deprived areas of England
Causes of avoidable mortality can be categorised into broad groups. As previous research has found a relationship between broad causes of avoidable mortality and deprivation, the socioeconomic differences in cardiovascular diseases, injuries and respiratory diseases were investigated.
The cardiovascular diseases section and the injuries section (which includes intentional and unintentional injuries) of the avoidable mortality definition did not change throughout the period 2001 to 2016, so direct comparisons across the whole time series are possible.
Avoidable mortality caused by cardiovascular diseases significantly decreased over the 16 years for both males and females in the most and least deprived areas. However, the largest change was observed in the least deprived areas, where rates more than halved, with a 60% decrease for males and a 64% decrease for females.
Although, the mortality rate for males in the most deprived areas nearly halved between 2001 and 2016 (from 301.5 to 155.4 deaths per 100,000) it remained significantly and sizeably higher than the rate in the least deprived areas. This pattern was also observed for females.
Figure 3: Age-standardised avoidable mortality rates for cardiovascular diseases by sex
England, 2001 to 2016
Source: Office for National Statistics
Notes:
- Figures are for deaths registered in each calendar year.
- Figures for England exclude deaths of non-residents.
- Age-standardised mortality rates are expressed per 100,000 population and standardised to the 2013 European Standard Population. Age-standardised mortality rates are used to allow comparison between populations which may contain different proportions of people of different ages.
- Deprivation deciles are based on the Index of Multiple Deprivation (IMD) which is the official measure of relative deprivation. IMD 2004 was used for the data years 2001 to 2005, IMD 2007 was used for years 2006 to 2008, IMD 2010 was used for years 2009 to 2013 and IMD 2015 was used for years 2014 to 2016.
- Decile 1 represents the most deprived and decile 10 represents the least deprived.
Download this chart Figure 3: Age-standardised avoidable mortality rates for cardiovascular diseases by sex
Image .csv .xlsFrom 2001 to 2010, the avoidable mortality rate for injuries for both males and females in the most and least deprived areas decreased with a significant drop for males in the most deprived areas from 78.3 deaths per 100,000 to 65.1 deaths per 100,000. However, from 2010 to 2016 increases in mortality rates were observed for those in both the most and least deprived areas with a significant increase in males in the most deprived areas to 79.8 deaths per 100,000. These recent increases counter any improvements made in the first 10 years of the time series in the most deprived areas with the male and female rate in 2016 higher than it was in 2001.
Further analysis of the number of avoidable deaths caused by injuries showed that most deaths were a result of unintentional injuries (transport accidents and accidental injury).
Figure 4: Age-standardised avoidable mortality rates for injuries by sex
England, 2001 to 2016
Source: Office for National Statistics
Notes:
- Figures are for deaths registered in each calendar year.
- Figures for England exclude deaths of non-residents.
- Age-standardised mortality rates are expressed per 100,000 population and standardised to the 2013 European Standard Population. Age-standardised mortality rates are used to allow comparison between populations which may contain different proportions of people of different ages.
- Deprivation deciles are based on the Index of Multiple Deprivation (IMD) which is the official measure of relative deprivation. IMD 2004 was used for the data years 2001 to 2005, IMD 2007 was used for years 2006 to 2008, IMD 2010 was used for years 2009 to 2013 and IMD 2015 was used for years 2014 to 2016.
- Decile 1 represents the most deprived and decile 10 represents the least deprived.
Download this chart Figure 4: Age-standardised avoidable mortality rates for injuries by sex
Image .csv .xlsAs part of the definition change in 2014, some diseases were added to the respiratory diseases section. The effect of this change on the overall respiratory diseases data for England was small; however, caution is advised when comparing data for 2001 to 2013 and 2014 to 2016.
The size of mortality rates for respiratory diseases were sharply contrasting between those living in the most and least deprived areas (Figure 5). For males and females in the most deprived areas, any decreases observed from 2001 to 2010 were removed by marked increases in the most recent year. In 2016, mortality rates for males and females in the most deprived areas were significantly higher than those in the least deprived areas; for males, there were 75.7 deaths per 100,000 compared with 11.7 deaths per 100,000; for females, the comparative contrast was 60.8 deaths per 100,000 compared with 8.0 deaths per 100,000.
The substantially higher rates observed in the most deprived areas compared with the least deprived areas are likely to be a consequence of persistently higher smoking prevalance among disadvantaged populations, despite considerable investment in smoking cessation services (PDF 462KB) since the start of the new millennium.
Figure 5: Age-standardised avoidable mortality rates for respiratory diseases by sex
England, 2001 to 2016
Source: Office for National Statistics
Notes:
- Data years 2001 to 2010 are based on a slightly different avoidable mortality definition compared to 2016.
- Figures are for deaths registered in each calendar year.
- Figures for England exclude deaths of non-residents.
- Age-standardised mortality rates are expressed per 100,000 population and standardised to the 2013 European Standard Population. Age-standardised mortality rates are used to allow comparison between populations which may contain different proportions of people of different ages.
- Deprivation deciles are based on the Index of Multiple Deprivation (IMD) which is the official measure of relative deprivation. IMD 2004 was used for the data years 2001 to 2005, IMD 2007 was used for years 2006 to 2008, IMD 2010 was used for years 2009 to 2013 and IMD 2015 was used for years 2014 to 2016.
- Decile 1 represents the most deprived and decile 10 represents the least deprived.
Download this chart Figure 5: Age-standardised avoidable mortality rates for respiratory diseases by sex
Image .csv .xlsAvoidable mortality 4.5 times more likely in males in most deprived areas in England
The slope index of inequality (SII) represents the difference between the hypothetical “most” and “least” deprived on the deprivation scale. The SII in overall avoidable mortality in England was wider for males in contrast to females (Figures 6 and 7).
From 2001 to 2013, the SII for males had significantly decreased (from 461.0 to 340.4 deaths per 100,000). However, non-significant increases were observed after 2013 with the SII in 2016 indicating that the most deprived areas experienced an additional 362.3 deaths per 100,000 compared with the least deprived.
The relative index of inequality (RII) reports the ratio of avoidable mortality for the least to the most deprived populations. Figure 6 illustrates how the RII for males has increased over the past 16 years. In 2001, males in the most deprived areas were 3.5 times more likely to die from an avoidable cause than those in the least deprived areas; in 2016, this had grown to 4.5 times more likely.
Figure 6: Trend in absolute (SII) and relative (RII) inequality for males
England, 2001 to 2016

Source: Office for National Statistics
Notes:
- Data years 2001 to 2013 and 2014 to 2016 are based on different avoidable mortality definitions. As a result, the data for these years are not directly comparable.
- Figures are for deaths registered in each calendar year.
- Figures for England exclude deaths of non-residents.
- The SII is reported as a positive value to demonstrate increasing mortality rates with increasing deprivation. However, because the relative rank ranges from 0 (most deprived) to 100 (least deprived) the actual SII is negative.
Download this image Figure 6: Trend in absolute (SII) and relative (RII) inequality for males
.PNG (8.7 kB) .xls (33.3 kB)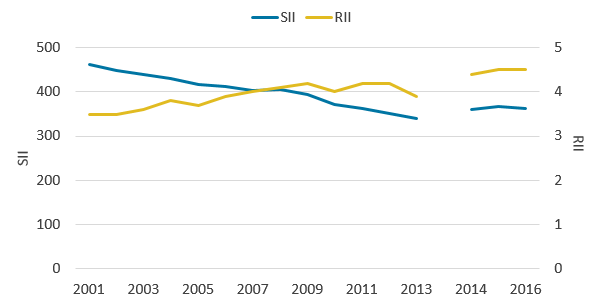
The SII for females also decreased significantly from 2001 to 2013 (from 235.6 deaths to 193.2 deaths per 100,000). From 2014, however, a non-significant increase was observed in the SII indicating that in 2016, there were 208.2 additional deaths per 100,000 in the most deprived female populations compared with the least deprived.
In 2001, the RII indicated that females in the most deprived areas were 3.0 times more likely to die from an avoidable cause than those in the least deprived areas. In 2016, the RII had increased to 3.9 times more likely.
These results for both males and females suggest highly contrasting avoidable mortality risks were present in England over the period 2001 to 2016. While the absolute gap between the most and least deprived has contracted between 2001 and 2016, relative gaps have grown, showing that the link between socioeconomic deprivation and avoidable mortality has strengthened.
Figure 7: Trend in absolute (SII) and relative (RII) inequality for females
England, 2001 to 2016

Source: Office for National Statistics
Notes:
- Data years 2001 to 2013 and 2014 to 2016 are based on different avoidable mortality definitions. As a result, the data for these years are not directly comparable.
- Figures are for deaths registered in each calendar year.
- Figures for England exclude deaths of non-residents.
- The SII is reported as a positive value to demonstrate increasing mortality rates with increasing deprivation. However, because the relative rank ranges from 0 (most deprived) to 100 (least deprived) the actual SII is negative
Download this image Figure 7: Trend in absolute (SII) and relative (RII) inequality for females
.PNG (8.7 kB) .xls (33.3 kB)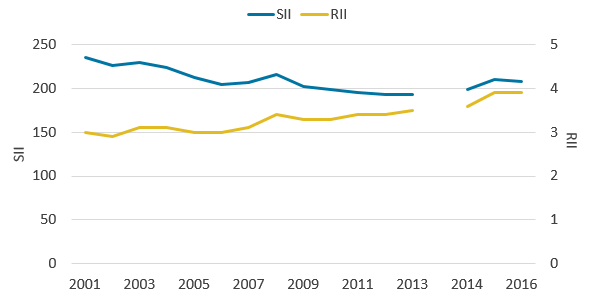
5. Relationship between avoidable mortality and deprivation in Wales
Avoidable mortality rates consistently highest in the most deprived local areas in Wales
Different measures of area-level deprivation are used in England and Wales so measures of socioeconomic inequality in avoidable mortality were estimated separately for each country and comparisons between countries are not advised.
From 2001 to 2013, the avoidable mortality rate for males living in the most and least deprived areas has fluctuated resulting in an overall significant decrease; rates for the most deprived areas declined by 16% (from 631.7 to 529.8 deaths per 100,000) and rates for the least deprived declined by 29% (from 279.6 to 199.0 deaths per 100,000). The Wales average also significantly decreased by 27% (from 435.1 to 316.2 deaths per 100,000).
From 2014 to 2016, mortality rates for the most and least deprived areas non-significantly decreased while the Wales average significantly increased.
Figure 8: Age-standardised avoidable mortality rates for males
Wales, 2001 to 2016
Source: Office for National Statistics
Notes:
- Data years 2001 to 2013 and 2014 to 2016 are based on different avoidable mortality definitions. As a result, the data for these years are not directly comparable.
- Figures are for deaths registered in each calendar year.
- Figures for Wales exclude deaths of non-residents.
- Age-standardised mortality rates are expressed per 100,000 population and standardised to the 2013 European Standard Population. Age-standardised mortality rates are used to allow comparison between populations which may contain different proportions of people of different ages.
- Deprivation deciles are based on the Welsh Index of Multiple Deprivation (WIMD) which is the official measure of relative deprivation. IMD 2005 was used for data years 2001 to 2006, IMD 2008 was used for years 2007 to 2009, IMD 2011 was used for years 2010 to 2013 and IMD 2014 was used for years 2014 to 2016.
- Decile 1 represents the most deprived and decile 10 represents the least deprived.
Download this chart Figure 8: Age-standardised avoidable mortality rates for males
Image .csv .xlsFor females, the avoidable mortality rates in the most deprived areas, least deprived areas and the Wales average show similar patterns to males with significant decreases from 2001 to 2013. However, from 2014 to 2016 there was a non-significant increase in mortality rates observed in females living in the most deprived areas. Females living in the least deprived areas and the Wales average both experienced increases (with the Wales average being significant) between 2014 and 2015 followed by a decrease (with the least deprived areas being significant) between 2015 and 2016.
Figure 9: Age-standardised avoidable mortality for females
Wales, 2001 to 2016
Source: Office for National Statistics
Notes:
- Data years 2001 to 2013 and 2014 to 2016 are based on different avoidable mortality definitions. As a result the data for these years are not directly comparable.
- Figures are for deaths registered in each calendar year.
- Figures for Wales exclude deaths of non-residents.
- Age-standardised mortality rates are expressed per 100,000 population and standardised to the 2013 European Standard Population. Age-standardised mortality rates are used to allow comparison between populations which may contain different proportions of people of different ages.
- Deprivation deciles are based on the Welsh Index of Multiple Deprivation (WIMD) which is the official measure of relative deprivation. IMD 2005 was used for data years 2001 to 2006, IMD 2008 was used for years 2007 to 2009, IMD 2011 was used for years 2010 to 2013 and IMD 2014 was used for years 2014 to 2016.
- Decile 1 represents the most deprived and decile 10 represents the least deprived.
Download this chart Figure 9: Age-standardised avoidable mortality for females
Image .csv .xlsAvoidable deaths from injuries and respiratory diseases increased in most deprived areas of Wales
As with England we report the relationship between deprivation and three broad causes of avoidable mortality: cardiovascular diseases, injuries and respiratory diseases.
As the avoidable mortality definition is the same for both England and Wales, comparisons could be made for cardiovascular diseases and injuries across the time series from 2001 to 2016 as the definition did not change as part of our recent review of the avoidable mortality definition. However, selective respiratory diseases were added to the respiratory diseases section of the definition and was deemed avoidable in those aged 1 to 14. Impact analysis on data year 2013 showed no change in Wales data as a result of this addition. However, caution is still recommended when comparing respiratory diseases across the whole series.
Mortality rates for males significantly decreased for avoidable cardiovascular diseases in both the most and least deprived areas from 2001 to 2016. Even though the mortality rate for males living in the most deprived areas halved, they remain significantly and sizeably higher than those in the least deprived areas in 2016.
Mortality rates for females in the most deprived areas significantly decreased from 2001 to 2010; however, a small non-significant increase was observed from 2010 to 2016. Like males, avoidable mortality rates for females living in the most deprived areas were significantly higher than females living in the least deprived areas in 2016.
Figure 10: Age-standardised avoidable mortality rates for cardiovascular diseases by sex
Wales, 2001 to 2016
Source: Office for National Statistics
Notes:
- Figures are for deaths registered in each calendar year.
- Figures for Wales exclude deaths of non-residents.
- Age-standardised mortality rates are expressed per 100,000 population and standardised to the 2013 European Standard Population. Age-standardised mortality rates are used to allow comparison between populations which may contain different proportions of people of different ages.
- Deprivation deciles are based on the Welsh Index of Multiple Deprivation (WIMD) which is the official measure of relative deprivation. IMD 2005 was used for data years 2001 to 2006, IMD 2008 was used for years 2007 to 2009, IMD 2011 was used for years 2010 to 2013 and IMD 2014 was used for years 2014 to 2016.
- Decile 1 represents the most deprived and decile 10 represents the least deprived.
Download this chart Figure 10: Age-standardised avoidable mortality rates for cardiovascular diseases by sex
Image .csv .xlsThe mortality rates for injuries (intentional and unintentional injuries) in Wales showed a fluctuating picture between sexes, deciles and years.
From 2001 to 2016, steady increases in avoidable mortality rates for injuries were observed in males living in the most deprived areas from 79.1 deaths per 100,000 to 88.5 deaths per 100,000. This is a marked contrast to males living in the least deprived areas whose rate in 2016 was the lowest recorded at 29.6 deaths per 100,000.
Avoidable mortality rates for injuries for females living in the most deprived areas decreased slightly from 2001 to 2010. However, from 2010 to 2016 a non-significant increase was observed with the avoidable mortality rate for injuries reaching its highest level of 51.0 deaths per 100,000, significantly higher than females living in the least deprived areas.
Further analysis of the number of avoidable deaths caused by injuries showed that most deaths were a result of unintentional injuries (transport accidents and accidental injury).
Figure 11: Age-standardised avoidable mortality rates for injuries by sex
Wales, 2001 to 2016
Source: Office for National Statistics
Notes:
- Figures are for deaths registered in each calendar year.
- Figures for Wales exclude deaths of non-residents.
- Age-standardised mortality rates are expressed per 100,000 population and standardised to the 2013 European Standard Population. Age-standardised mortality rates are used to allow comparison between populations which may contain different proportions of people of different ages.
- Deprivation deciles are based on the Welsh Index of Multiple Deprivation (WIMD) which is the official measure of relative deprivation. IMD 2005 was used for data years 2001 to 2006, IMD 2008 was used for years 2007 to 2009, IMD 2011 was used for years 2010 to 2013 and IMD 2014 was used for years 2014 to 2016.
- Decile 1 represents the most deprived and decile 10 represents the least deprived.
Download this chart Figure 11: Age-standardised avoidable mortality rates for injuries by sex
Image .csv .xlsThe size of mortality rates for respiratory diseases in Wales were sharply contrasting between those living in the most and least deprived areas (Figure 12). For males and females living in the most deprived areas, increases were observed from 2001 to 2016 with a non-significant increase of 60% for males and a significant 63% increase for females; whereas mortality rates for males and females living in the least deprived areas remained at a similar level across the time series.
The impact analysis for the definition change for respiratory diseases showed no effect on Wales avoidable mortality rates. The marked increases in respiratory disease avoidable mortality rates in those living in the most deprived areas suggest that other factors related to deprivation could be driving this.
Figure 12: Age-standardised avoidable mortality rates for respiratory diseases by sex
Wales, 2001 to 2016
Source: Office for National Statistics
Notes:
- Data years 2001 to 2010 are based on a slightly different avoidable mortality definition compared to 2016.
- Figures are for deaths registered in each calendar year.
- Figures for Wales exclude deaths of non-residents.
- Age-standardised mortality rates are expressed per 100,000 population and standardised to the 2013 European Standard Population. Age-standardised mortality rates are used to allow comparison between populations which may contain different proportions of people of different ages.
- Deprivation deciles are based on the Welsh Index of Multiple Deprivation (WIMD) which is the official measure of relative deprivation. IMD 2005 was used for data years 2001 to 2006, IMD 2008 was used for years 2007 to 2009, IMD 2011 was used for years 2010 to 2013 and IMD 2014 was used for years 2014 to 2016.
- Decile 1 represents the most deprived and decile 10 represents the least deprived.
Download this chart Figure 12: Age-standardised avoidable mortality rates for respiratory diseases by sex
Image .csv .xlsAvoidable mortality 3.8 times more likely in females in most deprived areas in Wales
The slope index of inequality (SII) for males in Wales, as shown in Figure 13, fluctuated throughout the time series with an overall non-significant decrease between 2001 to 2013 from 374.3 deaths per 100,000 to 313.1 deaths per 100,000. However, increases were observed in the most recent years with the SII in 2016 indicating 351.9 additional deaths per 100,000 were experienced by the most deprived populations compared with the least deprived.
The relative index of inequality (RII) follows a similar pattern to the SII. In 2001, males in the most deprived areas were 2.5 times more likely to die from an avoidable cause compared with males living in the least deprived areas. However, in 2016 this had increased to 3.3 times more likely.
Figure 13: Trend in absolute (SII) and relative (RII) inequality for males
Wales, 2001 to 2016

Source: Office for National Statistics
Notes:
- Data years 2001 to 2013 and 2014 to 2016 are based on different avoidable mortality definitions. As a result, the data for these years are not directly comparable.
- Figures are for deaths registered in each calendar year.
- Figures for Wales exclude deaths of non-residents.
- The SII is reported as a positive value to demonstrate increasing mortality rates with increasing deprivation. However, because the relative rank ranges from 0 (most deprived) to 100 (least deprived) the actual SII is negative.
Download this image Figure 13: Trend in absolute (SII) and relative (RII) inequality for males
.PNG (10.5 kB) .xls (33.3 kB)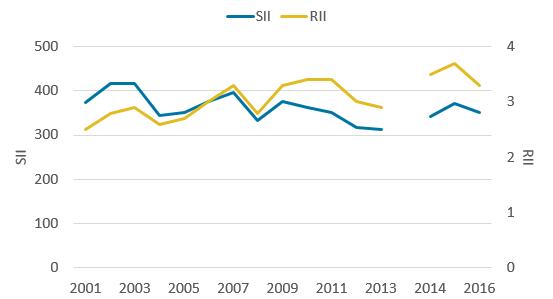
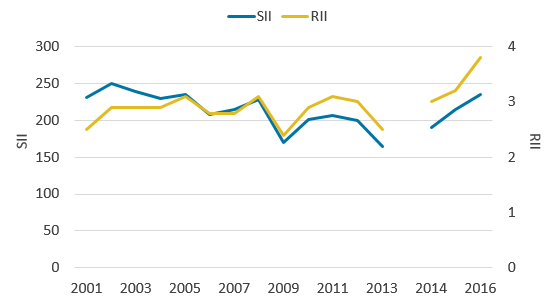
The SII for females fluctuated throughout the time series with an overall significant decrease from 231.0 deaths per 100,000 in 2001 to 165.0 deaths per 100,000 in 2013. From 2014, however, marked increases were observed with the SII in 2016, indicating 234.6 additional deaths per 100,000 were experienced by the most deprived populations compared with the least deprived. As such the SII ended the series higher than in 2001.
Even though the RII for females fluculated from 2001 to 2013, it returned to its 2001 value in 2013 with females living in the most deprived areas 2.5 times more likely to die from an avoidable cause than those living in the least deprived. From 2014 to 2016, however, the RII increased to 3.8 times more likely (the highest point of the time series), which was a consequence of the SII growing sharply.
The results for both males and females suggest highly contrasting mortality risks were present in Wales and represent considerable opportunity for health improvement through a reduction in deaths considered avoidable amongst the most deprived populations.
Figure 14: Trend in absolute (SII) and relative (RII) inequality for females
Wales, 2001 to 2016
Source: Office for National Statistics
Notes:
- Data years 2001 to 2013 and 2014 to 2016 are based on different avoidable mortality definitions. As a result, the data for these years are not directly comparable.
- Figures are for deaths registered in each calendar year.
- Figures for Wales exclude deaths of non-residents.
- The SII is reported as a positive value to demonstrate increasing mortality rates with increasing deprivation. However, because the relative rank ranges from 0 (most deprived) to 100 (least deprived) the actual SII is negative.
Download this image Figure 14: Trend in absolute (SII) and relative (RII) inequality for females
.PNG (10.5 kB) .xls (33.3 kB)
6. Quality and methodology
The avoidable mortality Quality and Methodology Information report contains important information on:
- the strengths and limitations of the data and how it compares with related data
- uses and users of the data
- how the output was created
- the quality of the output including the accuracy of the data
Age-standardised rates
Age-standardised rates were calculated using the number of potentially avoidable deaths registered in each year as the numerator and the mid-year population estimate for that year as the denominator.
Although age limits were set for some cause groups, rates were calculated using people of all ages as the denominator to allow data by cause group, amenable and preventable categories to be presented on a comparable basis.
Differences referred to in this article are based on unrounded figures. A difference that is described as “statistically significant” has been assessed using 95% confidence intervals. If a difference is said to be statistically significant, it is unlikely that it could have occurred by chance alone. Confidence intervals give a measure of the statistical precision of an estimate and show the range of uncertainty around the estimated figure. As a general rule, if the confidence interval around an estimate overlaps with the interval around another, there is no significant difference between the two estimates. When the number of deaths is less than 100, the method used to calculate confidence intervals is different (see Dobson and others, 1991).
Avoidable mortality definition
Two different avoidable mortality definitions were used to calculate the data. For years 2001 to 2013, figures were based on the avoidable mortality definition that was relevant during that time. In 2015, a public consultation was conducted to review the avoidable mortality definition and as a result, a revised definition was created that is used for data years 2014 to 2016. As the data for 2001 to 2013 and 2014 to 2016 are based on different avoidable mortality definitions, the figures are not directly comparable.
For most of the causes of death included in our avoidable mortality definition there is an upper age limit of 74 years. This is because deaths among those aged 75 years and over are often difficult to attribute definitively to a single underlying cause and the chances of death are more affected by coexisting medical conditions and other factors.
Measures of deprivation used
England’s Index of Multiple Deprivation (IMD) is calculated using seven domains:
- income
- employment
- education, skills and training
- health and disability
- crime
- barriers to housing and services
- living environment
Different versions of the IMD were used for the time series:
- IMD 2004 was used for data years 2001 to 2005
- IMD 2007 was used for data years 2006 to 2008
- IMD 2010 was used for data years 2009 to 2013
- IMD 2015 was used for data years 2014 to 2016
The Welsh Index of Multiple Deprivation (WIMD) is based on eight domains:
- income
- employment
- health
- education
- access to services
- community safety
- physical environment
- housing
Different versions of the WIMD were used for the time series:
- WIMD 2005 was used for data years 2001 to 2006
- WIMD 2008 was used for data years 2007 to 2009
- WIMD 2011 was used for data years 2010 to 2013
- WIMD 2014 was used for data years 2014 to 2016
Using area-based deprivation as a measure of socioeconomic circumstances in cross-sectional analysis has its limitations. In addition to the issues of using the IMD to classify everyone living in such areas, there is also the issue of health-related migration, whereby more healthy people are likely to move and cluster in less deprived areas and vice versa, which will to some extent exaggerate the relationship between area deprivation and health.
In most cases IMD deprivation scores accurately linked onto the lower super output areas (LSOAs). However, for 5% of the LSOAs this was not possible because of geography boundary changes that were implemented in 2011. For these cases, an average deprivation score of all LSOAs was calculated and an average score imputed to these select LSOAs.
Measures of inequality used
In this article both absolute and relative measures of inequality were used. Absolute measures of inequality quantify the difference in health outcomes between the most and least deprived. Relative measures quantify the magnitude of the difference, that is: how many times the health outcome is greater or lesser in the most compared with the least deprived. The two main inequality indicators reported use weighted linear regression to model the inequality in avoidable mortality across deprivation deciles by taking account of the size of the gaps across all adjacent deciles and the relative contributions they make to the overall inequality.
The slope index of inequality (SII) is reported using positive values to demonstrate increasing avoidable mortality rates with increasing deprivation rather than decreasing avoidable mortality with decreasing deprivation. The relative rank, a measure of socioeconomic advantage used in the model, ranges from 0 (most deprived) to 100 (least deprived) so for this outcome, which grows with increasing deprivation, the actual SII value is negative. For example, when we report an SII value of 461.0 in age-standardised rates, it represents an absolute gap (mortality difference) of 461.0 deaths per 100,000 people. This can also be expressed as an additional 461.0 deaths per 100,000 people experienced by the most deprived compared with the least deprived populations.
The relative index of inequality (RII) acts as a ratio showing how much more likely an outcome of interest (in this case avoidable mortality and its components) occurs in the hypothetical most deprived populations compared with the hypothetical least deprived populations.
The SII was calculated in the statistical software package Stata. Deciles were ordered by decreasing area deprivation, that is, from the most to the least deprived. The fraction of the total population in each decile (f) was calculated. The cumulative frequency (ci), that is, the cumulative sum of the population in successively less deprived deciles, was also obtained and the relative deprivation rank (x) for each decile was calculated as:
This formula calculates the relative deprivation rank for use in the SII calculation. The SII (slope of the regression line) was then estimated by regressing age-standardised rates for each decile against the relative deprivation rank (x), weighted by the population in each decile.
The confidence intervals for the SII are calculated using a simulation program. Simulation is a method used to estimate the degree of uncertainty for measures where the statistical distributions underpinning the measure are too complex to analyse mathematically. For each decile, age-standardised rates have been calculated along with its standard error (SE). These SEs give information about the degree of uncertainty around each of the values: essentially it describes a statistical distribution for each decile. Using a random-number-generating algorithm, a random value is taken from each decile age-standardised rate distribution and the SII recalculated. This is repeated many times (for example, 100,000), to build up a distribution of SII values based on random sampling from the decile age-standardised rate distributions. The 2.5% and 97.5% values from this distribution of SII values is then reported as the 95% confidence interval for the SII, rather than that based on 10 observations representing the deciles.
The RII and associated confidence intervals is based on Fieller’s method of computing the Kunst Mackenbach RII. Fieller’s method uses the following formulae:
and the resulting ratio is then added by negative 1.
And the confidence interval (CI) for RIIKM is computed as:
where c is the critical value of the t distribution used in the calculation of the variances of the coefficients. SE is the standard error of the SII available from the weighted regression equation.
Back to table of contents