
1. Main points
- Avoidable, amenable and preventable mortality is strongly related to area deprivation in England and in Wales.
- In England in 2015 there were 16,686 deaths from avoidable causes in the most deprived areas whereas there were less than half that number (7,247 deaths) in the least deprived areas.
- In the most deprived areas of Wales there were 1,054 deaths from avoidable causes in 2015, compared with 509 deaths in the least deprived areas.
- Absolute and relative inequalities in avoidable mortality between those living in the most and least deprived areas were sizeable and highly significant, but the excess was larger for males than females in all cases.
- The largest relative inequality in avoidable mortality was for deaths from respiratory diseases which were 4.8 times (males) and 7.7 times (females) more likely in the most deprived populations compared with the least deprived.
- The largest absolute difference in avoidable mortality between the most and least deprived deciles was from cardiovascular disease and cancer.
2. Statistician’s comment
"The link between avoidable mortality and deprivation is strongest for avoidable respiratory diseases. The most deprived populations in England and Wales are up to 7.7 times more likely to die from an avoidable respiratory disease than the least deprived. Smoking is the most likely contributory factor to these differences.
However, it is in the cases of cardiovascular disease and cancer where the inequalities in mortality seen between more and less deprived areas can be most reduced overall. Narrowing the gaps in mortality for these diseases will have benefits for the largest number of people."
Dr Annie Campbell, Health Analysis and Life Events, Office for National Statistics
Back to table of contents3. Things you need to know about this release
What is avoidable mortality?
Avoidable mortality refers to deaths from causes that are considered avoidable in the presence of timely and effective healthcare or public health interventions. Overall avoidable mortality can be divided into two sub-categories, amenable and preventable mortality.
Deaths are considered amenable if, in the light of medical knowledge and technology available at the time of death, all or most deaths from these causes could be avoided through good quality, timely healthcare.
Deaths are considered preventable if, in the light of understanding of the determinants of health at the time of death, all or most deaths from these causes could be avoided by public health interventions.
In instances where a cause can be both amenable and preventable, deaths are only counted once in the overall avoidable mortality figure.
While a particular cause of death can be considered avoidable in principle, this doesn’t mean that every death from that cause could have been averted. This is because factors such as the lifestyle and age of the patient, the extent of disease progression at diagnosis and the potential existence of other medical conditions are not taken into account when determining which causes to include.
For most of the causes of death included in our definition there is an upper age limit of 74 years. This is because deaths among those aged 75 years and over are often difficult to attribute definitively to a single underlying cause and the chances of death are more affected by coexisting medical conditions and other factors.
Which mortality measures do we report?
We report age-standardised mortality rates and standardised years of life lost (SYLL) for different deprivation groups. More information about how these are calculated can be found in the Quality and Methodology section of this report.
How have we measured socioeconomic deprivation?
We measure socioeconomic deprivation using the Index of Multiple Deprivation (IMD), which provides an overall relative measure of deprivation for each lower layer super output area (LSOA). The overall IMD scores are ranked for all LSOAs within a country and can be divided into 10 groups (deciles) where decile 1 represents the most deprived LSOAs and decile 10 represents the least deprived LSOAs. Our results are reported in terms of these IMD deciles.
Deprivation deciles have been calculated separately for LSOAs in England and for LSOAs in Wales as their IMDs are not comparable. The Quality and Methodology section of this report details the domains each country’s IMD contains.
The IMD is a score based on the area as a whole and not everyone within a LSOA necessarily experiences the same level or type of deprivation. For example, some unemployed individuals live in less deprived LSOAs, while some higher-income individuals live in more deprived LSOAs. Similarly, deciles are a broad grouping and the levels of deprivation and the underlying factors determining the LSOA-level IMD score will vary within the decile. Those LSOAs at the higher and lower end of each decile may vary considerably from each other. The widest variation is within deciles 1 and 10.
How have we measured inequality?
In this article we use both absolute and relative measures of inequality. Absolute measures of inequality quantify the difference in health outcomes between the most and least deprived. Whereas relative measures quantify the magnitude of the difference, that is: how many times the health outcome is greater in the most compared with the least deprived. Absolute measures quantify the size of the inequality overall whilst the relative measures quantify the strength of the relationship between the outcome and in this instance level of deprivation.
The two main inequality indicators reported use weighted linear regression to model the inequality in avoidable mortality across deprivation deciles by taking account of the size of the gaps across all adjacent deciles and the relative contributions they make to the overall inequality.
The Slope Index of Inequality (SII) represents the difference in the outcome of interest between hypothetical “most” and “least” deprived on the deprivation scale, based on a line of best fit using a regression equation. This is an absolute measure of inequality.
We report the SII as positive values to demonstrate increasing avoidable mortality rates with increasing deprivation, though because the relative rank ranges from 0 (most deprived) to 100 (least deprived) the actual SII is negative. For example, when we report an SII value of 210.1 in age-standardised rates, it represents an absolute gap (mortality difference) of 210.1 deaths per 100,000 people. This can also be expressed as an additional 210.1 deaths per 100,000 people experienced by the most deprived compared with the least deprived populations.
The Relative Index of Inequality (RII) acts as a ratio showing how much more likely an outcome of interest (in this case avoidable mortality and its components) occurs in the hypothetical most deprived populations compared with the hypothetical least deprived populations.
It is necessary to mention the limitations of using area-based deprivation as a measure of socioeconomic circumstances in cross-sectional analysis. In addition to the issues of using an area-based measure of deprivation such as the IMD to classify everyone living in such areas, there is also the issue of health-related migration, whereby more healthy people are likely to move and cluster in less deprived areas and the other way around, which will to some extent exaggerate the relationship between area deprivation and health. We intend to investigate the impact of such selection effects in future work using longitudinal data.
Back to table of contents4. Background
It is widely accepted that the impact on population health of both primary preventive actions, aimed at reducing exposure to health risks, as well as healthcare more generally, should be quantified. Avoidable mortality, which is based on the concept that deaths from certain conditions should be rare and ideally should not occur in the presence of timely and effective healthcare, is used as an indicator to inform this contribution.
This report aims to illustrate how much avoidable mortality occurred among males and females exposed to varying levels of deprivation in England and Wales in 2015. As such it measures the magnitude of area-based socioeconomic inequality in avoidable deaths, and thereby gives a pointer to the relative success of interventions designed to avert such deaths.
A number of studies have found strong relationships between avoidable mortality and socioeconomic inequalities across different countries and areas. For example, Bell, Robinson and Laverty (2016) found that standardised death rates for avoidable, amenable and preventable mortality in Northern Ireland were two to three times higher for the most deprived compared with the least deprived. They also found the same inequality in number of years of life lost. Similar results have been found in Scotland (Grant and others, 2006), Cumbria (Brown and Beynon, 2013) and Australia and New Zealand (Page and others, 2006) where avoidable mortality rates were significantly larger in the most deprived areas compared with the least deprived areas.
Relationships between the broad causes of avoidable mortality and deprivation have also been reported. For example, in Cumbria the numbers of persons dying prematurely from respiratory diseases, cardiovascular diseases and neoplasms (cancerous and non-cancerous growths) were significantly higher among the most deprived compared with the least deprived (Brown and Beynon, 2013). In Northern Ireland, it was found that the most deprived were twice as likely to die from cancer and three times more likely to die from respiratory diseases compared with the least deprived (Bell, Robinson and Laverty, 2016).
The Marmot Review (2010) and The Commission on Social Determinants of Health (2008) outlined potential reasons for the relationship between avoidable mortality and socioeconomic inequality. Both reports explain that social inequalities in health arise due to inequalities in society, such as conditions of daily life, education, power, money and resources. This means those with a higher social position are more likely to have better health than those with a lower social position and therefore lower risk of premature death.
Back to table of contents5. Relationship between avoidable mortality and deprivation in England
Most deprived people in England in 2015 suffered more than 9,400 additional deaths from avoidable causes than least deprived
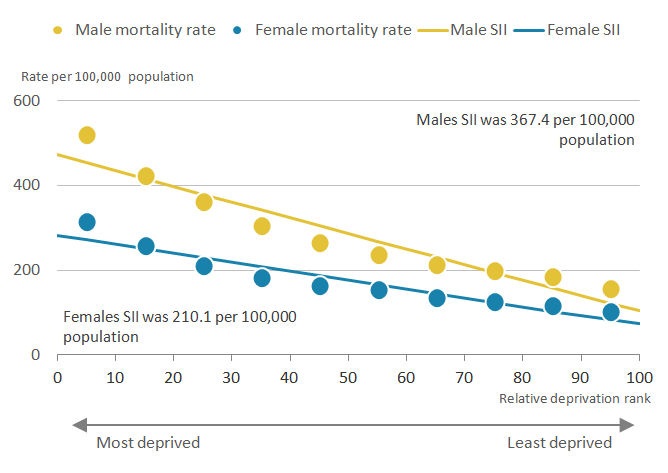
For males in England in 2015, there was a clear socioeconomic gradient in age-standardised avoidable mortality; specifically, rates grew in line with increasing exposure to deprivation across the distribution (Figure 1). For females the gradient was somewhat shallower overall than that observed for males. However, for both sexes the pattern was much shallower across the least deprived deciles, particularly between deciles 7 to 9.
Figure 1: Inequality in age-standardised avoidable mortality rates by sex and deprivation decile
England, 2015
Source: Office for National Statistics
Notes:
- Figures are for deaths registered in 2015.
- Figures for England exclude deaths of non-residents.
- The SII is reported as a positive value to demonstrate increasing mortality rates with increasing deprivation. However because the relative rank ranges from 0 (most deprived) to 100 (least deprived) the actual SII is negative.
Download this image Figure 1: Inequality in age-standardised avoidable mortality rates by sex and deprivation decile
.PNG (19.9 kB) .xls (28.7 kB)
For males the steepest gradient was observed between decile 1 (most deprived) and decile 2, with rates declining sizeably from decile 1 towards decile 4. For females, the gradient was also steepest between deciles 1 and 2. Additionally, the avoidable mortality rate in decile 1 was significantly higher than the rate in all other deciles for males and females alike.
For example, the mortality rate for males in decile 1 (most deprived) was 520.6 per 100,000, significantly decreasing to 157.9 per 100,000 in decile 10 (least deprived). For females, the mortality rate in decile 1 was 315.0 per 100,000, significantly decreasing to 102.7 per 100,000 in decile 10.
In each decile-specific comparison, males had a significantly higher avoidable mortality rate than females. However, males exposed to lower levels of deprivation (those living in deciles 6 and above) had a statistically significant lower rate of avoidable mortality than females in decile 1: this supports the notion that socioeconomic advantage was compensating for gender disadvantage in regard to avoidable deaths, as was the case for life expectancy (ONS, 2017; ONS, 2015).
The Slope Index of Inequality (SII) in overall avoidable mortality in England was steeper for males than females (Figure 1). The difference in age-standardised rates between the least and most deprived males, as measured by the SII, was 367.4 deaths per 100,000, compared with 210.1 deaths per 100,000 for females. However, for each sex these results suggest highly contrasting mortality risks were present in England in 2015 and represent considerable opportunity for health improvement through a reduction in deaths considered avoidable amongst the most deprived populations.
The gender imbalance is also reflected in the relative index of inequality (RII). The RII reports the ratio of avoidable mortality for the least to the most deprived populations. The rates for the most deprived males in England were 4.5 times greater compared with the least deprived; whereas for females it was 3.9 times greater.
Deaths from avoidable respiratory diseases had strongest relationship with deprivation in England in 2015
As previous research has found a relationship between broad causes of avoidable mortality and deprivation, the top four causes of avoidable mortality are reported here. These are: cardiovascular diseases, neoplasms, injuries and respiratory diseases.
Meaningful interpretation of the Slope Index of Inequality (SII) and Relative Index of Inequality (RII) depends on a broadly linear relationship across categories. Because of the smaller numbers of deaths from individual causes compared with avoidable morality as a whole and the consequently greater variability at smaller geographical levels, the regression line calculated does not necessarily represent the overall inequality within the population in the way intended.
Consequently, for the cause-specific analyses, two simple alternative measures of inequality were used to quantify the gap between the most and least deprived instead of the SII and RII. The first calculates absolute inequality as the difference between age-standardised avoidable deaths in the most and least deprived deciles, while the second calculates the ratio of these rates in the most to least deprived deciles to estimate the relative inequality. These indicators ignore the inequality among the intervening deciles and are considered less informative compared with the SII and RII. However, they are included in this instance for context and to provide you with alternative measures of inequality.
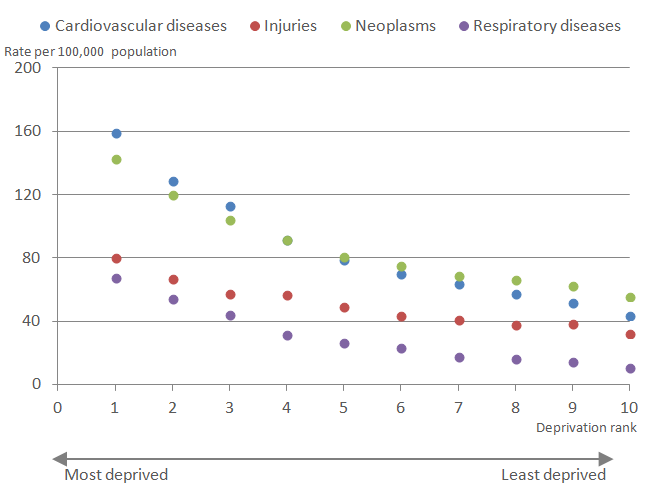
Figure 2 shows that the contribution of the four causes to avoidable mortality was not consistent across deciles. Among males in deciles 1 to 4, cardiovascular diseases made the greatest contribution to avoidable mortality overall, followed by neoplasms, injuries and then respiratory diseases. However, among males in deciles 5 to 10, neoplasms made the greatest contribution.
Figure 2: Avoidable mortality rates by cause and Index of Multiple Deprivation decile, males
England, 2015
Source: Office for National Statistics
Notes:
- Figures are for deaths registered in 2015.
- Figures for England exclude deaths of non-residents.
Download this image Figure 2: Avoidable mortality rates by cause and Index of Multiple Deprivation decile, males
.PNG (15.4 kB) .xls (20.0 kB)
Table 1 shows the variation across cause groups in absolute and relative measures of inequality in age-standardised mortality rates per 100,000 between decile 1 and decile 10 in England in 2015. For males in England, the largest gap in avoidable mortality rates between decile 1 and 10 was observed for cardiovascular diseases (115.8 per 100,000), followed by neoplasms (87.5 per 100,000), respiratory diseases (57.4 per 100,000) and finally injuries (48.2 per 100,000).
Table 1: Range and ratio of age-standardised avoidable mortality rates between deciles 1 and 10 by cause and sex, England, 2015
| England | ||||
| Male | Female | |||
| Range | Ratio | Range | Ratio | |
| Cardiovascular diseases | 115.8 | 3.6 | 53.5 | 3.9 |
| Injuries | 48.2 | 2.5 | 18.6 | 2.0 |
| Neoplasms | 87.5 | 2.6 | 61.3 | 2.2 |
| Respiratory diseases | 57.4 | 6.3 | 50.7 | 7.7 |
| Source: Office for National Statistics | ||||
| Notes: | ||||
| 1. Figures are for deaths registered in 2015 | ||||
| 2. Figures for Wales exclude deaths of non-residents | ||||
| 3. See the 'definition' tab within the data tables for further details of the underlying causes of death included | ||||
| 4. The range calculates the simple difference between the most and least deprived | ||||
| 5. The ratio shows the relative size between the age-standardised mortality rates of the most and least deprived | ||||
Download this table Table 1: Range and ratio of age-standardised avoidable mortality rates between deciles 1 and 10 by cause and sex, England, 2015
.xls (27.6 kB)Looking at relative measures of inequality by cause, for males in England, the ratio was highest for respiratory diseases, followed by cardiovascular diseases, neoplasms and injuries. Males in decile 1 were 6.3 times more likely to die from respiratory diseases than males in decile 10. This is likely to be a consequence of persistent higher smoking prevalence among disadvantaged populations, despite considerable investment in smoking cessation services since the start of the new millennium (Smoking Kills: A White Paper on Tobacco, 1998).
In contrast to males, for females in England, the absolute difference in mortality rates between decile 1 and 10 was highest for neoplasms, followed by cardiovascular diseases, respiratory diseases and finally injuries (Table 1).
As shown in Figure 3, mortality rates were highest for neoplasms and cardiovascular diseases, followed by respiratory diseases and then injuries for deciles 1 to 4. From decile 5 and above, deaths from avoidable injuries were higher than for respiratory diseases.
Figure 3: Avoidable mortality rates by cause and Index of Multiple Deprivation decile, females
England, 2015

Source: Office for National Statistics
Notes:
Figures are for deaths registered in 2015.
Figures for England exclude deaths of non-residents.
Download this image Figure 3: Avoidable mortality rates by cause and Index of Multiple Deprivation decile, females
.PNG (15.8 kB) .xls (20.0 kB)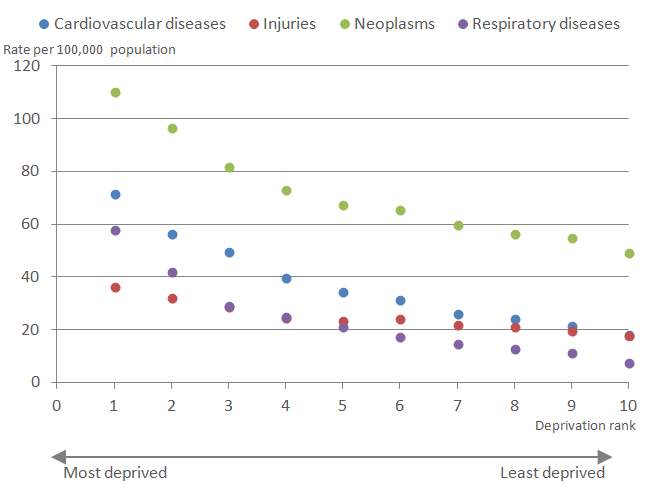
When looking at relative gaps, the ratio of avoidable deaths between decile 1 and 10 was highest for respiratory diseases where females in decile 1 were 7.7 times more likely to die from avoidable respiratory diseases, a larger relative gap than observed for males (see Table 1); in fact the rate of death from respiratory diseases in decile 1 exceeded that from neoplasms in decile 10 (Figure 3). Smaller relative gaps were observed for deaths from cardiovascular diseases (3.9), neoplasms (2.2) and injuries (2.0).
Most deprived males 5.2 times more likely to die from a cause considered amenable to healthcare than least deprived males
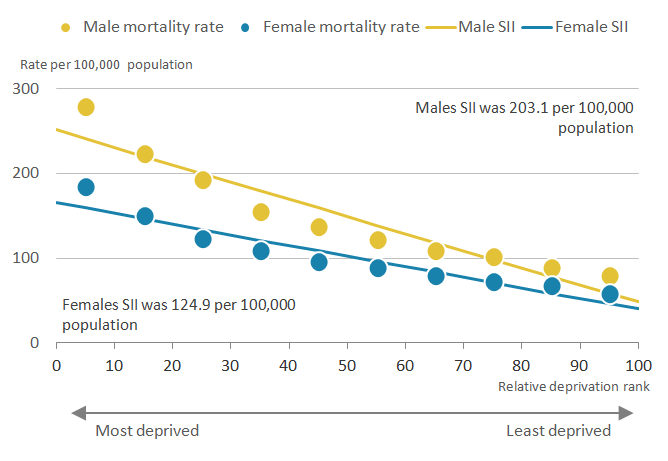
The relationship between amenable mortality and deprivation follows a very similar pattern to overall avoidable mortality where those living in the most deprived areas in England in 2015 had the highest rates of amenable mortality compared with those living in the least deprived areas, see Figure 4. These deaths have a more focused link to healthcare and are therefore a high-level outcome indicator of healthcare services.
Figure 4: Inequality in age-standardised amenable mortality rates by sex and deprivation decile
England, 2015
Source: Office for National Statistics
Notes:
- Figures are for deaths registered in 2015.
- Figures for England exclude deaths of non-residents.
- The SII is reported as a positive value to demonstrate increasing mortality rates with increasing deprivation. However because the relative rank ranges from 0 (most deprived) to 100 (least deprived) the actual SII is negative.
Download this image Figure 4: Inequality in age-standardised amenable mortality rates by sex and deprivation decile
.PNG (20.5 kB) .xls (20.5 kB)
Age-standardised amenable mortality rates for males and females in the most deprived decile were 279.1 per 100,000 and 184.1 per 100,000 respectively; this compares with 79.1 per 100,000 and 58.0 per 100,000 in the least deprived areas. As with overall avoidable mortality, the largest decline between adjacent deciles occurred between deciles 1 to 2, with a 20% decrease for males and an 18.4% decrease for females.
"There was greater inequality in amenable mortality in England for males compared with females. The Slope Index of Inequality (SII) indicates that there were 203.1 more deaths per 100,000 among males in the most deprived areas of England compared with the least deprived. Whereas the SII between the most and least deprived females was lower, but still sizeable, at 124.9 deaths per 100,000.
While mortality rates in each decile were higher for males than females, mortality rates for the most deprived females did not significantly surpass the same mortality rates for males until decile 4.
These estimates show more marked contrasts beyond a certain deprivation threshold and pose questions concerning accessibility, quality and timeliness of healthcare for deprived populations.
A large relative inequality in amenable mortality as measured by the Relative Index of Inequality (RII) was also observed: for males, amenable mortality was 5.2 times greater among the most deprived compared with the least deprived; for females it was 4.1 times greater.
Although the absolute gap in amenable mortality was smaller than for avoidable mortality, the relative gap was greater for each sex indicating a stronger relationship between amenable mortality and deprivation.
Deaths from preventable causes were 4.5 times higher for most deprived males
The pattern of preventable mortality in England in 2015 is shown in Figure 5; rates were highest amongst the most deprived and lowest among the least deprived.
Figure 5: Inequality in age-standardised preventable mortality rates by sex and deprivation decile
England, 2015

Source: Office for National Statistics
Notes:
- Figures are for deaths registered in 2015.
- Figures for England exclude deaths of non-residents.
- The SII is reported as a positive value to demonstrate increasing mortality rates with increasing deprivation. However because the relative rank ranges from 0 (most deprived) to 100 (least deprived) the actual SII is negative.
Download this image Figure 5: Inequality in age-standardised preventable mortality rates by sex and deprivation decile
.PNG (19.8 kB) .xls (20.5 kB)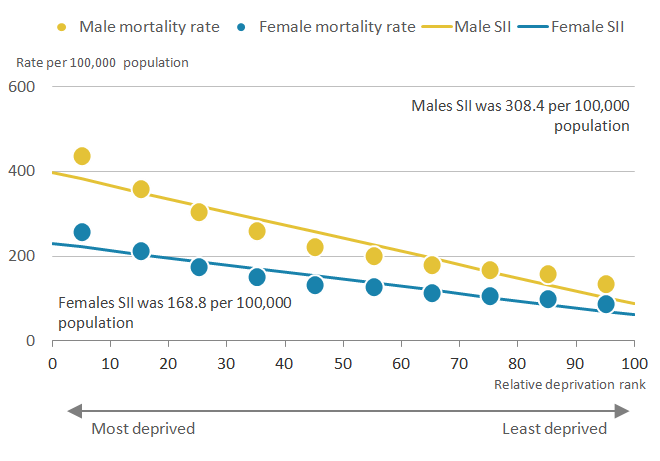
Age-standardised preventable mortality rates for both sexes significantly decreased from 436.1 per 100,000 males and 256.6 per 100,000 females in decile 1 (most deprived) to 133.5 per 100,000 males and 86.6 per 100,000 females in decile 10. The largest decline in mortality rates in males occurred between deciles 1 and 2 with a decrease of 18%, however, for females the largest decline was actually between deciles 2 to 3 where there was an 18.2% decline (0.6% larger than the decline between decile 1 to 2).
The gradient for females was somewhat shallower between deciles 6 to 10 inclusive than for males, but for each sex the gradients were noticeably steeper between deciles 4 and 1 inclusive. This caused the preventable mortality rate in females in decile 1 to be higher than it was for males in decile 5 and above; as a consequence, more than half of the male population in England were less likely to die from preventable causes than females living in the most deprived areas.
There was also a greater inequality in preventable mortality in England for males compared with females. The Slope Index of Inequality (SII) in preventable mortality rates between the most and least deprived males was 308.4 deaths per 100,000 whereas the SII between the most and least deprived females was 168.8 deaths per 100,000.
This sex difference was also seen in the Relative Index of Inequality (RII) where preventable mortality rates in the most deprived males were 4.5 times greater compared with the least deprived males and for the most deprived females preventable mortality rates were 3.7 times greater than the least deprived females.
Most deprived lose more potential years of life to avoidable causes than least deprived
To complement analysis of age-standardised avoidable mortality rates, we have also examined the relationship between deprivation and standardised years of life lost (SYLL). SYLL measures the potential number of years of life lost when a person dies prematurely from an avoidable cause (relative to average life expectancy for the country and sex of the individual).
In England, there was a clear relationship between deprivation and SYLL for avoidable mortality where significantly more years of life were being lost to avoidable mortality in the most deprived areas compared with the least deprived areas.
Table 2 displays the absolute (SII) and relative (RII) measures of inequality in SYLLs by avoidable, amenable and preventable mortality and sex in England in 2015.
As shown there are greater levels of inequality across both measures of inequality in males compared with females.
For overall avoidable mortality, the absolute measure of inequality (Slope Index of Inequality, SII) found there to be 8,234.9 more years of life lost per 100,000 in the most, compared with the least, deprived males. For females this was 4,972.6 years of life lost per 100,000 females. The relative measure of inequality showed that males in the most deprived areas lost 5 times the number of years of life than those in the least deprived areas. For females this was 4.1 times.
Table 2: Slope Index of Inequality (SII) and Relative Index of Inequality (RII) for standardised years of life lost for avoidable, amenable and preventable mortality by sex, England, 2015
| Males | Females | ||||
| SII | RII | SII | RII | ||
| Avoidable mortality | 8,234.9 | 5.0 | 4,972.6 | 4.1 | |
| Amenable mortality | 4,259.9 | 5.5 | 2,837.6 | 3.8 | |
| Preventable mortality | 6,870.8 | 5.0 | 3,967.1 | 4.0 | |
| Source: Office for National Statistics | |||||
| Notes: | |||||
| 1. Figures are for deaths registered in 2015. | |||||
| 2. Figures for England exclude deaths of non-residents. | |||||
| 3. The SII is reported as a positive value to demonstrate increasing mortality rates with increasing deprivation. However because the relative rank ranges from 0 (most deprived) to 100 (least deprived) the actual SII is negative. | |||||
Download this table Table 2: Slope Index of Inequality (SII) and Relative Index of Inequality (RII) for standardised years of life lost for avoidable, amenable and preventable mortality by sex, England, 2015
.xls (27.6 kB)For deaths from causes considered either amenable to healthcare or preventable there were also significantly more standardised years of life lost (SYLL) among males and females living in the most deprived areas than in the least deprived areas in England (Table 2).
Back to table of contents6. Relationship between avoidable mortality and deprivation in Wales
Most deprived people in Wales suffered more than 500 additional deaths from avoidable causes than least deprived in 2015
Different measures of area-level deprivation are used in England and Wales so measures of socioeconomic inequality in avoidable mortality were estimated separately for each country and are not comparable.
Clear patterns of socioeconomic inequality in age-standardised avoidable mortality rates were found in Wales in 2015 as shown in Figure 6, where age-standardised mortality rates increased with increasing deprivation.
Figure 6: Inequality in age-standardised avoidable mortality rates by sex and deprivation decile
Wales, 2015
Source: Office for National Statistics
Notes:
- Figures are for deaths registered in 2015.
- Figures for Wales exclude deaths of non-residents.
- The SII is reported as a positive value to demonstrate increasing mortality rates with increasing deprivation. However because the relative rank ranges from 0 (most deprived) to 100 (least deprived) the actual SII is negative.
Download this image Figure 6: Inequality in age-standardised avoidable mortality rates by sex and deprivation decile
.PNG (20.6 kB) .xls (20.5 kB)
The avoidable mortality rate for males in decile 1 (most deprived) was 543.9 per 100,000 and decreased significantly in each adjacent decile contrast to 174.4 per 100,000 in decile 10 (least deprived). For females, the avoidable mortality rate in decile 1 was 333.7 per 100,000 with a statistically significant decrease occurring in most adjacent decile contrasts to 139.8 per 100,000 in decile 10. The steepest decreases in avoidable mortality rates in Wales were from deciles 1 to 2 and this was more prominent for males than females as in England.
Across all deciles of deprivation, there were significantly higher avoidable mortality rates for males relative to females. It was only for males in decile 7 and above where mortality rates were significantly lower than for females in decile 1. Consequently, there was evidence in Wales of socioeconomic advantage acting as a counter-weight to gender disadvantage in avoidable mortality rates.
In Wales, absolute measures of inequality in avoidable mortality were wider for males than females with a Slope Index of Inequality (SII) of 370.9 deaths per 100,000 males, compared with 215.0 deaths per 100,000 for females. This gap was also reflected in relative measures of inequality. The Relative Index of Inequality (RII) showed in Wales the most deprived males were 3.7 times more likely to die from avoidable causes compared with the least deprived males; for females it was 3.2 times more likely. An opportunity to affect health improvement is clearly evident in Wales through reducing deaths from avoidable causes in disadvantaged areas.
Most deprived females in Wales 6.7 times more likely to die from avoidable respiratory disease than least deprived
As with England we report the relationship between deprivation and the top four causes of avoidable mortality. These are: cardiovascular diseases, neoplasms (cancerous and non-cancerous growths), injuries and respiratory diseases.
Again, in common with England, it was inappropriate to calculate the Slope Index of Inequality (SII) and Relative Index of Inequality (RII) for cause breakdowns. Instead we report absolute inequality as the difference between age-standardised mortality in the most and least deprived deciles and relative inequality as the ratio of the measure of interest in the most to least deprived deciles.
Figure 7 shows that the contribution of the four causes to avoidable mortality was not consistent across deciles. Among males, cardiovascular diseases made the greatest contribution to avoidable mortality in most deciles, followed by neoplasms, injuries and then respiratory diseases. However, among males in decile 6 neoplasms made the greatest contribution.
Figure 7: Avoidable mortality rates by cause and Index of Multiple Deprivation decile, males
Wales, 2015

Source: Office for National Statistics
Notes:
- Figures are for deaths registered in 2015.
- Figures for Wales exclude deaths of non-residents.
Download this image Figure 7: Avoidable mortality rates by cause and Index of Multiple Deprivation decile, males
.PNG (15.8 kB) .xls (20.0 kB)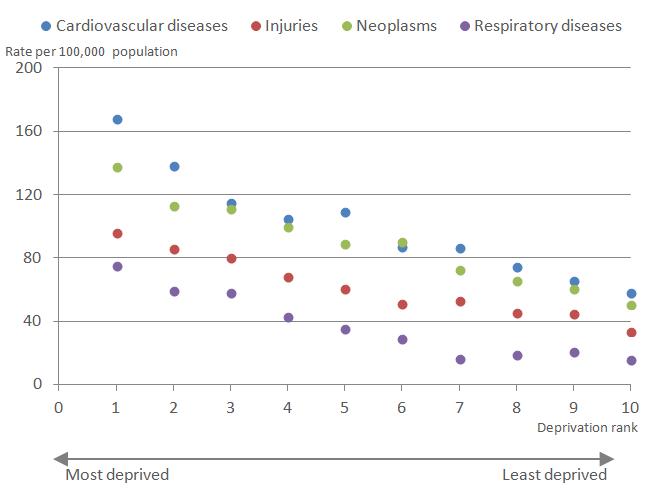
For Wales, the absolute gap in mortality rates between males in decile 1 (most deprived) and 10 (least deprived) was highest for cardiovascular diseases, followed by neoplasms, injuries and respiratory diseases (see Table 3).
Table 3: Range and ratio of age-standardised avoidable mortality rates between deciles 1 and 10 by cause and sex, Wales, 2015
| Wales | ||||
| Male | Female | |||
| Range | Ratio | Range | Ratio | |
| Cardiovascular diseases | 110.3 | 2.9 | 51.4 | 3.6 |
| Injuries | 62.7 | 2.8 | 11.8 | 1.5 |
| Neoplasms | 87.4 | 2.7 | 33.3 | 1.5 |
| Respiratory diseases | 60.0 | 4.8 | 70.3 | 6.7 |
| Source: Office for National Statistics | ||||
| Notes: | ||||
| 1. Figures are for deaths registered in 2015. | ||||
| 2. Figures for Wales exclude deaths of non-residents. | ||||
| 3. See the 'definition' tab within the data tables for further details of the underlying causes of death included. | ||||
| 4. The range calculates the simple difference between the most and least deprived. | ||||
| 5. The ratio shows the relative size between the age-standardised mortality rates of the most and least deprived. | ||||
Download this table Table 3: Range and ratio of age-standardised avoidable mortality rates between deciles 1 and 10 by cause and sex, Wales, 2015
.xls (27.6 kB)Table 3 also includes the ratio of avoidable deaths between decile 1 and 10 representing the relative inequality: for males this was highest for respiratory diseases, followed by cardiovascular diseases, injuries and then neoplasms.
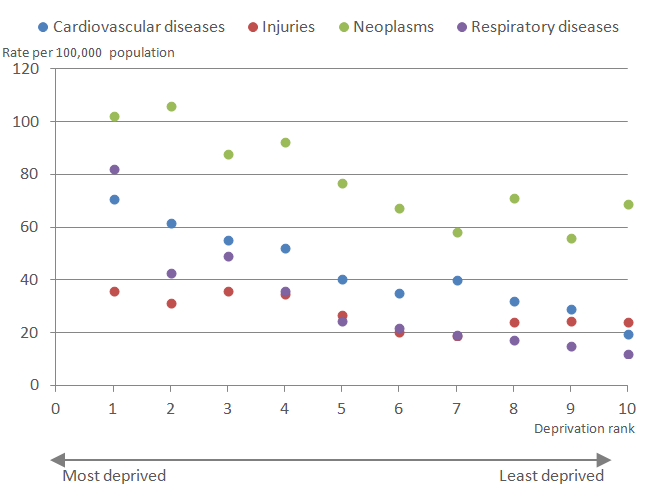
Figure 8 shows for females the contribution of each cause to avoidable mortality is different to those for males. Neoplasms made the greatest contribution to avoidable mortality in all deciles. The subsequent order varied by decile where cardiovascular disease often made the second biggest contribution, with the exception of decile 1 where respiratory diseases were more prominent.
Figure 8: Avoidable mortality rates by cause and Index of Multiple Deprivation decile, females
Wales, 2015
Source: Office for National Statistics
Notes:
- Figures are for deaths registered in 2015.
- Figures for Wales exclude deaths of non-residents.
Download this image Figure 8: Avoidable mortality rates by cause and Index of Multiple Deprivation decile, females
.PNG (15.7 kB) .xls (20.0 kB)
For females, the absolute gap in avoidable mortality between decile 1 and decile 10 was highest for respiratory diseases followed by cardiovascular diseases, neoplasms and injuries (Table 3).
The ratio of avoidable mortality rates for females in Wales between deciles 1 and 10 was highest for respiratory diseases, followed by cardiovascular diseases and the ratio for injuries was slightly higher than for neoplasms (Table 3).
SII shows most deprived males in Wales saw 201.3 extra deaths amenable to healthcare per 100,000 than least deprived males in 2015
As shown in Figure 9, age-standardised mortality rates for deaths from conditions considered amenable to healthcare for males and females in Wales were higher in the most deprived decile (296.8 per 100,000 males and 207.1 per 100,000 females) compared with the least deprived decile (96.7 per 100,000 males and 85.7 per 100,000 females), but the absolute difference was wider for males.
Figure 9: Inequality in age-standardised amenable mortality rates by sex and deprivation decile
Wales, 2015

Source: Office for National Statistics
Notes:
- Figures are for deaths registered in 2015.
- Figures for Wales exclude deaths of non-residents.
- The SII is reported as a positive value to demonstrate increasing mortality rates with increasing deprivation. However because the relative rank ranges from 0 (most deprived) to 100 (least deprived) the actual SII is negative.
Download this image Figure 9: Inequality in age-standardised amenable mortality rates by sex and deprivation decile
.PNG (22.2 kB) .xls (20.5 kB)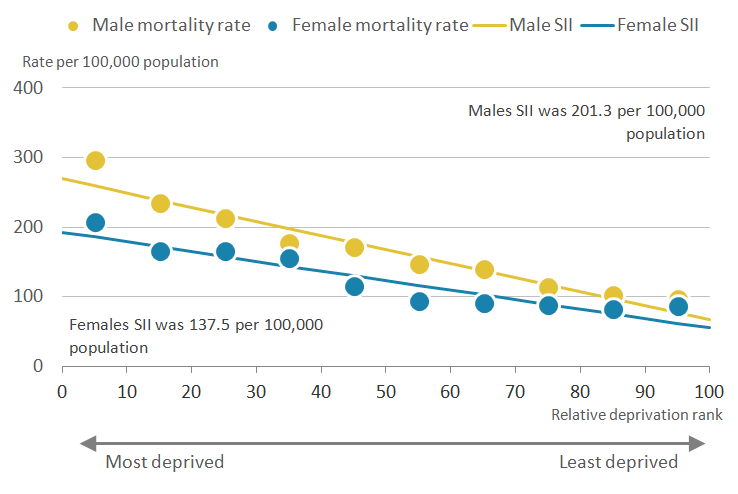
Amenable mortality rates for females in decile 1 (most deprived) did not significantly surpass the same mortality rates for males until decile 6. Again the steepest gradient was observed between deciles 1 and 2. Rates in decile 1 were clearly distinct from all other deciles for both sexes; however, females in deciles 2, 3 and 4 had similar rates, as did deciles 6 through 10, showing the effect of deprivation on amenable mortality for females in Wales is less finely graded than in England.
The absolute inequality as measured by the Slope Index of Inequality (SII) between the most and least deprived males, was higher (201.3 deaths per 100,000) compared with the most and least deprived females (137.5 deaths per 100,000). However, the relationship between amenable mortality and deprivation is quite irregular in Wales; this means the SII underestimated the rate of death in deciles 1 and 10, but to a greater extent in decile 1 and thereby underestimating the likely extent of the inequality.
The Relative Index of Inequality (RII) showed the most deprived males were 4.0 times more likely to die from amenable causes than the least deprived; for females it was 3.5 times more likely.
Although the absolute gap in amenable mortality was smaller than for avoidable mortality, the relative gap was greater for males indicating a stronger relationship between amenable mortality and deprivation.
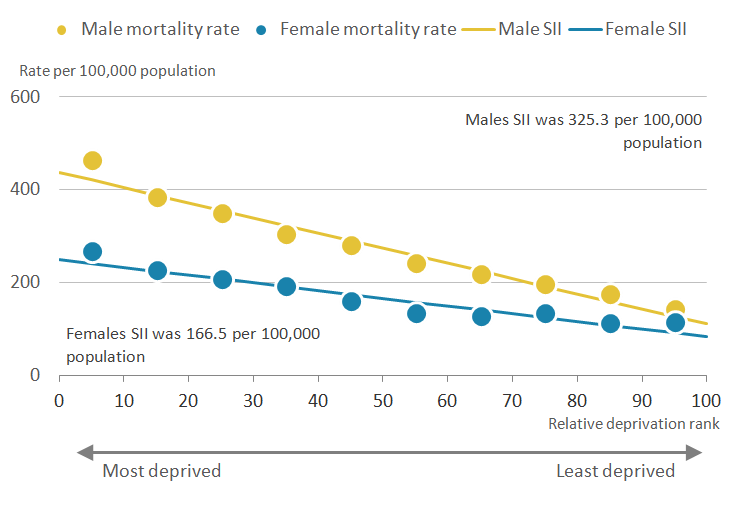
Deaths from preventable causes 3.9 times more likely in most deprived than least deprived males in Wales in 2015
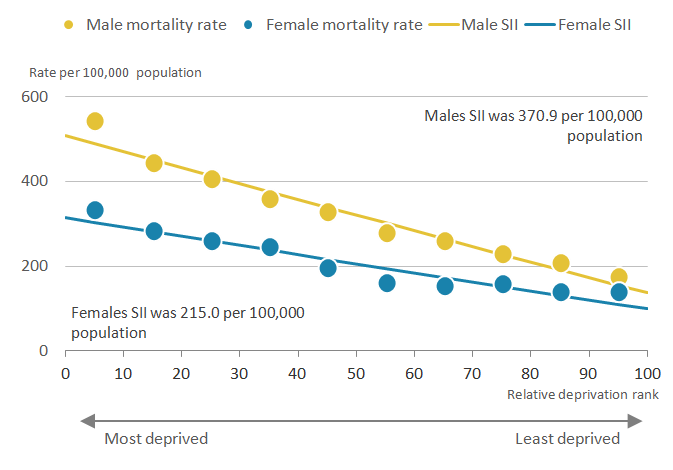
In Wales, age-standardised mortality rates for males and females were higher in decile 1 (464.4 per 100,000 males and 267.6 per 100,000 females) compared with those in decile 10 (143.2 per 100,000 males and 114.5 per 100,000 females), see Figure 10. For both sexes, sharper decreases in rates of death were observed between deciles 1 to 4 inclusive and shallower contrasts between deciles 6 and 10 inclusive.
There was a weaker relationship between deprivation and preventable mortality rates in females than males. However, the preventable mortality rate in females in decile 1 was still found to be higher than it was for males in decile 6 and above; as a consequence, approximately half of the male population in Wales were more likely to die from preventable causes than females living in the most deprived areas.
Figure 10: Inequality in age-standardised preventable mortality rates by sex and deprivation decile
Wales, 2015
Source: Office for National Statistics
Notes:
Figures are for deaths registered in 2015.
Figures for Wales exclude deaths of non-residents.
The SII is reported as a positive value to demonstrate increasing mortality rates with increasing deprivation. However because the relative rank ranges from 0 (most deprived) to 100 (least deprived) the actual SII is negative
Download this image Figure 10: Inequality in age-standardised preventable mortality rates by sex and deprivation decile
.PNG (21.7 kB) .xls (21.0 kB)
Measuring absolute inequality, the Slope Index of Inequality (SII) in preventable mortality rates between the most and least deprived males was 325.3 deaths per 100,000 whereas the SII between the most and least deprived females was smaller at 166.5 deaths per 100,000.
The Relative Index of Inequality (RII) showed preventable mortality rates in the most deprived males were 3.9 times greater than the least deprived males and for females they were 3.0 times greater.
Most deprived males in Wales lost 8,219.8 more potential years of life per 100,000 than least deprived
In Wales there was a clear relationship between deprivation and standardised years of life lost (SYLL) for avoidable mortality where significantly more years of life were lost to avoidable mortality in the most deprived areas compared with the least deprived areas.
Table 4 displays the absolute (SII) and relative (RII) measures of inequality in SYLLs by avoidable, amenable and preventable mortality and sex in Wales in 2015.
For overall avoidable mortality there was greater inequality in SYLL in males, where the SII in SYLL between the most and least deprived males was 8,219.8 years per 100,000 males compared with 5,133.3 years per 100,000 females. This was again reflected in the RII where SYLL in the most deprived males was 3.9 times greater than the least deprived males and in the most deprived females was 3.4 times greater compared with the least deprived females.
Table 4: Slope Index of Inequality (SII) and Relative Index of Inequality (RII) for standardised years of life lost for avoidable, amenable and preventable mortality by sex, Wales, 2015
| Males | Females | ||||
| SII | RII | SII | RII | ||
| Avoidable mortality | 8,219.8 | 3.9 | 5,133.3 | 3.4 | |
| Amenable mortality | 4,054.7 | 4.0 | 2,990.8 | 3.2 | |
| Preventable mortality | 7,179.3 | 4.1 | 4,079.6 | 3.4 | |
| Source: Office for National Statistics | |||||
| Notes: | |||||
| 1. Figures are for deaths registered in 2015. | |||||
| 2. Figures for Wales exclude deaths of non-residents. | |||||
| 3. The SII is reported as a positive value to demonstrate increasing mortality rates with increasing deprivation. However because the relative rank ranges from 0 (most deprived) to 100 (least deprived) the actual SII is negative. | |||||
Download this table Table 4: Slope Index of Inequality (SII) and Relative Index of Inequality (RII) for standardised years of life lost for avoidable, amenable and preventable mortality by sex, Wales, 2015
.xls (19.5 kB)For amenable mortality, the absolute difference in SYLLs between most and least deprived males in Wales, as measured by the SII was 4,054.7 years per 100,000. This amounted to a relative gap of 4.0 times more years of life lost. For females the SII between the most and least deprived was 2,990.8 years per 100,000 with the years of life lost for the most deprived females being 3.2 times greater than the least deprived females.
These differences in inequality are also present in years of life lost due to causes considered preventable through public health interventions. The SII for most deprived and least deprived males was 7,179.3 years per 100,000 and the SII between the most deprived and least deprived females was 4,079.6 years per 100,000. The RII showed that years of life lost for the most deprived males were 4.1 times larger than the least deprived males and SYLL for the most deprived females was 3.4 times larger than the least deprived females. In Wales the relative gaps were larger for preventable than amenable mortality.
Back to table of contents7. Overall findings
For England, it was found that the widest absolute inequality in age-standardised avoidable mortality rates was observed in males. However, the largest relative inequality was observed for males for amenable mortality rates, where the highest Relative Index of Inequality (RII) was 5.2. This was also the case for standardised years of life lost where the RII was 5.5. While this analysis does not cover trends, a study examining the trend in inequality in amenable mortality between 2003 to 2004 and 2011 to 2012 suggested relative gaps in this indicator had grown (Asaria and others, 2016).
For Wales, again the largest absolute inequality in both age-standardised rates and standardised years of life lost was observed in males for overall avoidable mortality. In terms of relative inequality, the strongest relationship with deprivation was with amenable mortality in males for age-standardised rates but for standardised years of life lost it was preventable mortality in males.
The large variations in mortality expounded in this release will be connected to socioeconomic factors affecting health. Among these are likely to be variations in exposure to occupational, social, environmental and other risk factors for ill-health; willingness and opportunities to achieve healthier lifestyles; differences in seeking healthcare and advice; and inequities in the availability and quality of care.
The shape of the distribution in mortality reported in this article also needs commenting on. In almost all cases in England and in Wales, the inequality observed between the most deprived four deciles was somewhat larger than in other parts of the distribution. Of note was the sharp increase between decile 2 and decile 1, meaning that even among the relatively deprived, the extent of exposure is important for health and worsens more abruptly once a certain threshold of deprivation is passed.
In this article the Slope Index of Inequality (SII) has been used to measure health gaps. However, the shapes detected suggest the SII will be a conservative estimate and alternative approaches to measuring this inequality should be explored.
Back to table of contents8. Quality and methodology
The Avoidable mortality Quality and Methodology Information report contains important information on:
- the strengths and limitations of the data and how it compares with related data
- uses and users of the data
- how the output was created
- the quality of the output including the accuracy of the data
Age-standardised rates were calculated using the number of potentially avoidable deaths registered in each year as the numerator and the mid-year population estimate for that year as the denominator.
Although age limits were set for some cause groups, rates were calculated using people of all ages as the denominator to allow data by cause group, amenable and preventable categories to be presented on a comparable basis.
Standardised years of life lost (SYLL) is a measure of the potential years of life lost if the population of England and Wales had the same population structure as the 2013 European Standard Population (ESP). The rates are presented as years of life lost per 100,000 population. Detailed explanations on how this indicator is calculated are available in the avoidable mortality Quality and Methodology Information notes.
Differences referred to in this article are based on unrounded figures. A difference that is described as “statistically significant” has been assessed using 95% confidence intervals. If a difference is said to be statistically significant, it is unlikely that it could have occurred by chance alone. Confidence intervals give a measure of the statistical precision of an estimate and show the range of uncertainty around the estimated figure. As a general rule, if the confidence interval around an estimate overlaps with the interval around another, there is no significant difference between the two estimates. When the number of deaths is less than 100, the method used to calculate confidence intervals is different (see Dobson et al., 1991).
England’s measure of deprivation is based on the Index of Multiple Deprivation (IMD) 2015; this index is calculated using seven domains:
- Income
- Employment
- Education, skills and training
- Health and disability
- Crime
- Barriers to housing and services
- Living environment
Wales’s measure of deprivation is based on the Welsh Index of Multiple Deprivation (WIMD) 2014 eight domains:
- Income
- Employment
- Health
- Education
- Access to services
- Community safety
- Physical environment
- Housing
The Slope Index of Inequality (SII) was calculated in the statistical software package Stata. Deciles were ordered by decreasing area deprivation, that is, from the most to the least deprived. The fraction of the total population in each decile (f) was calculated. The cumulative frequency (ci), that is, the cumulative sum of the population in successively less deprived deciles, was also obtained and the relative deprivation rank (x) for each decile was calculated as:
This formula calculates the relative deprivation rank for use in the SII calculation. The SII (slope of the regression line) was then estimated by regressing age-standardised rates and standardised years of life lost (SYLL) for each decile against the relative deprivation rank (x), weighted by the population in each decile.
The confidence intervals for the SII are calculated using a simulation program. Simulation is a method used to estimate the degree of uncertainty for measures where the statistical distributions underpinning the measure are too complex to analyse mathematically. For each decile, age-standardised rates and standardised years of life lost have been calculated along with its standard error (SE). These SEs give information about the degree of uncertainty around each of the values: essentially it describes a statistical distribution for each decile. Using a random number-generating algorithm, a random value is taken from each decile's age-standardised rate and standardised years of life lost (SYLL) distribution and the SII recalculated. This is repeated many times (for example, 100,000), to build up a distribution of SII values based on random sampling from the decile LE distributions. The 2.5% and 97.5% values from this distribution of SII values is then reported as the 95% confidence interval for the SII, rather than that based on 10 observations representing the deciles.
The Relative Index of Inequality (RIIKM) and associated confidence intervals is based on Fieller’s method of computing the Kunst Mackenbach RII. Further details can be obtained from ONS on request.
Statistics on mortality are derived from the information provided when deaths are certified and registered. Further information about the methods and quality of these statistics can be found in the Quality and Methodology Information report. ONS holds mortality data for England and Wales.
Special extracts and tabulations of avoidable mortality (and other causes of mortality) data for England and Wales are available to order for a charge (subject to legal frameworks, disclosure control, resources and agreement of costs, where appropriate). Such requests or enquiries should be made to:
Mortality Analysis Team, Life Events and Population Sources Division
Office for National Statistics
Government Buildings
Cardiff Road
Newport
South Wales NP10 8XG
Tel: +44 (0)1633 456736
Email: mortality@ons.gov.uk.Our charging policy is available.