
1. Other pages in this release
Average household income, UK: financial year ending 2020
Back to table of contents2. Main points
In the period leading up to financial year ending (FYE) 2020 (April 2019 to March 2020), just before the coronavirus (COVID-19) pandemic, income decreased slightly to 35.4%, according to estimates from the Household Finances Survey
Income inequality remains close to record highs over the 10-year period leading up to FYE 2020; however, income inequality across the whole population was lower than levels reported during the economic downturn of FYE 2008 (38.6%).
While income inequality for people in retired households was stable over the five years leading up to FYE 2020, levels remained at near historical highs following a 4.2 percentage point increase between FYE 2010 and FYE 2016.
The gap between the richest in society and the rest of the population has widened over the 10-year period; the income share of the richest 1% increased from 7% to 8.2% between FYE 2011 and FYE 2020.
3. Analysis of income inequality
Figure 1: Income inequality has increased by 2.2 percentage points in the 10-year period leading up to financial year ending 2020
Gini coefficients for measures of original, gross and disposable income, UK, 1977 to financial year ending 2020

Source: Office for National Statistics – Household Finances Survey
Notes:
- FYE 2020, which represents the financial year ending 2020, (April to March), and similarly for all other years expressed in this format.
- Original income includes all sources of income from employment, private pensions, investments and other non-government sources. The receipt of cash benefits is then added to original income to estimate gross income. Finally, direct taxes are subtracted from gross income to estimate disposable income.
- Estimates of income inequality from FYE 2002 onwards have been adjusted for the under-coverage of top earners.
- Estimates up to and including financial year ending (FYE) 2017 are sourced from the Living Costs and Food (LCF) survey. Estimates from FYE 2018 onwards are based on the Household Finances Survey, which the LCF is part of.
Download this image Figure 1: Income inequality has increased by 2.2 percentage points in the 10-year period leading up to financial year ending 2020
.png (22.9 kB) .xls (41.5 kB)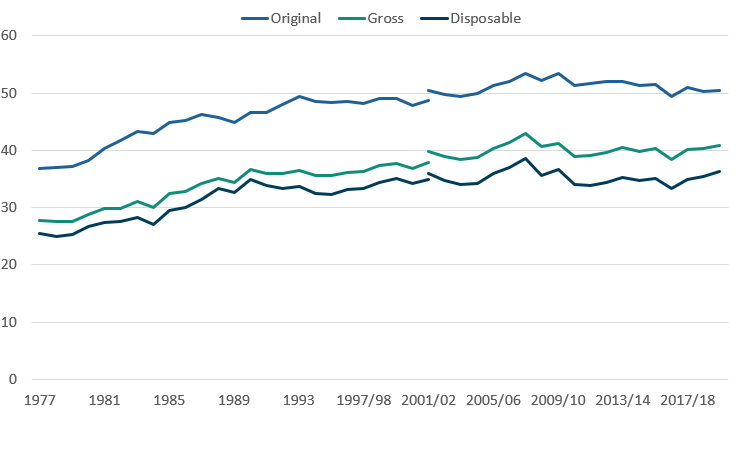
During the 10-year period leading up to financial year ending (FYE) 2020 (April 2019 to March 2020), income inequality increased by an average of 0.2 percentage points per year to 36.3%, as measured by the Gini coefficient. This was the highest level of income inequality since FYE 2010 but was lower than levels reported during the economic downturn of FYE 2008.
Figure 1 highlights that over the 10-year period to FYE 2020, the Gini coefficient for original income (which includes sources of income from employment, private pensions, investments and other income) remained stable. However, the Gini coefficient for gross income, increased by 1.8 percentage points. This highlights the diminishing effectiveness of cash benefits at reducing income inequality (demonstrated by the reduction in the gap between the Gini coefficients on original and gross income), most likely reflecting the moderation in the value of cash benefits received relative to households' original incomes.
Throughout 2020, households' finances have been affected because of restrictions and subsequent financial support measures put in place because of the coronavirus. The Personal and Economic Well-being bulletin presents analysis to understand how these have affected household income during this time.
Figure 2: Income inequality for people in retired households increased by 3.5 percentage points in the 10-year period leading up to financial year ending 2020
Gini coefficients for disposable income by household type, UK, 1977 to financial year ending 2020

Source: Office for National Statistics – Household Finances Survey
Notes:
- FYE 2020, which represents the financial year ending 2020, (April to March), and similarly for all other years expressed in this format.
- Estimates of income inequality from FYE 2002 onwards have been adjusted for the under-coverage of top earners.
- Estimates up to and including financial year ending (FYE) 2017 are sourced from the Living Costs and Food (LCF) survey. Estimates from FYE 2018 onwards are based on the Household Finances Survey, which the LCF is part of.
Download this image Figure 2: Income inequality for people in retired households increased by 3.5 percentage points in the 10-year period leading up to financial year ending 2020
.png (27.6 kB) .xls (41.0 kB)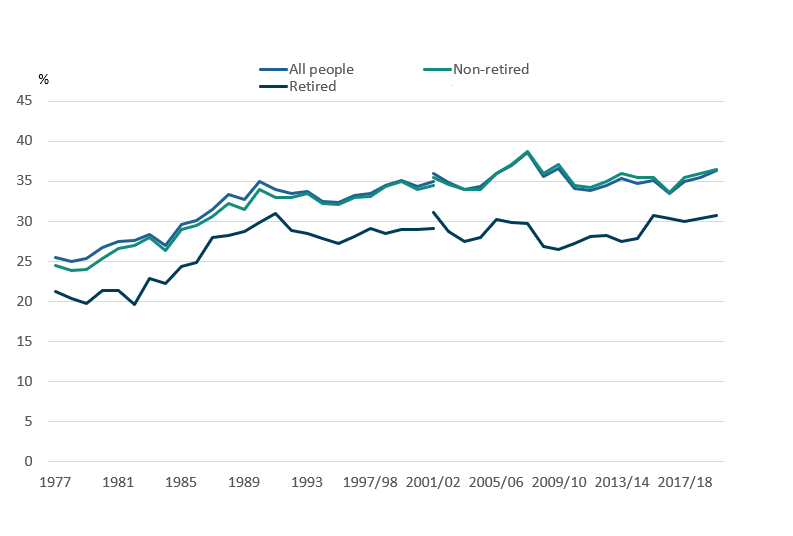
Income inequality for people in retired households increased by 3.5 percentage points to 30.7% in the 10-year period leading up to FYE 2020, although it remains broadly unchanged when compared over the last five years
By contrast, income inequality among individuals in non-retired households steadily increased on average by 0.2 percentage points a year to 36.5% between FYE 2011 and FYE 2020.
Figure 3: Alternative measures of inequality have increased to highest levels over the 10-year period to financial year ending 2020
S80/S20 ratio, P90/P10 ratio, Palma ratio, and top 1% share, equivalised disposable income, all people, UK, 1977 to financial year ending 2020

Source: Office for National Statistics – Household Finances Survey
Notes:
- FYE 2020, which represents the financial year ending 2020, (April to March), and similarly for all other years expressed in this format.
- Estimates of income inequality from FYE 2002 onwards have been adjusted for the under-coverage of top earners.
- Estimates up to and including financial year ending (FYE) 2017 are sourced from the Living Costs and Food (LCF) survey. Estimates from FYE 2018 onwards are based on the Household Finances Survey, which the LCF is part of.
Download this image Figure 3: Alternative measures of inequality have increased to highest levels over the 10-year period to financial year ending 2020
.png (24.0 kB) .xls (9.7 kB)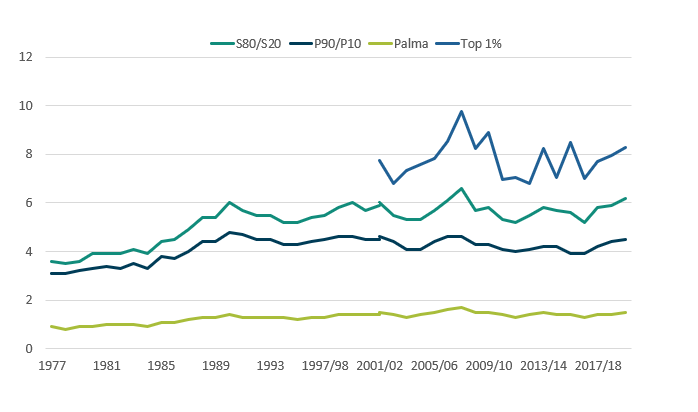
The characteristics of the Gini coefficient make it particularly useful for making comparisons over time, between countries and before or after taxes and benefits. However, one drawback of the Gini is that, as a single summary indicator, it cannot distinguish between different-shaped income distributions. For that reason, it is useful to look at this index alongside other measures of inequality.
One such measure is the S80/S20 ratio, which is the ratio of the total income received by the richest 20% of people to that received by the poorest 20%. In addition, the P90/P10 ratio compares the ratio of the income of the person at the bottom of the top 10% with that of the person at the top of the bottom 10%. Finally, the Palma ratio compares the ratio of the income share of the richest 10% of people with that of the poorest 40% of people. Together these measures provide further evidence on how incomes are shared across households and how this is changing over time.
In the 10-year period leading up to FYE 2020, the S80/S20 ratio increased from 5.3 to 6.2, its highest level since FYE 2008. Similarly, the P90/P10 ratio increased from 4.1 to 4.5, while the Palma ratio has remained broadly stable.
The amount of income accounted for by the richest 1% has increased by 1.3 percentage points to 8.3% between FYE 2011 and FYE 2020.
Back to table of contents4. Household income inequality data
The effects of taxes and benefits on household income, disposable income estimate
Dataset | Released 21 January 2021
Average UK household incomes taxes and benefits by household type, tenure status, household characteristics and long-term trends in income inequality.
5. Glossary
Disposable income
Disposable income is arguably the most widely used household income measure. Disposable income is the amount of money that households have available for spending and saving after direct taxes (such as Income Tax, National Insurance and Council Tax) have been accounted for. It includes earnings from employment, private pensions and investments as well as cash benefits provided by the state.
Equivalisation
Comparisons across different types of individuals and households (such as retired and non-retired, or rich and poor) or over time is done after income has been equivalised. Equivalisation is the process of accounting for the fact that households with many members are likely to need a higher income to achieve the same standard of living as households with fewer members. Equivalisation considers the number of people living in the household and their ages, acknowledging that while a household with two people in it will need more money to sustain the same living standards as one with a single person, the two-person household is unlikely to need double the income.
This analysis uses the modified Organisation for Economic Co-operation and Development (OECD) equivalisation scale (PDF, 165KB).
Measures of income inequality
The mean measure of income divides the total income of individuals by the number of individuals. A limitation of using the mean is that it can be influenced by just a few individuals with very high incomes and therefore does not necessarily reflect the standard of living of the “typical” person. However, when considering changes in income and direct taxes by income decile or types of households, the mean allows for these changes to be analysed in an additive way.
Many researchers argue that growth in median household incomes provides a better measure of how people's well-being has changed over time. The median household income is the income of what would be the middle person, if all individuals in the UK were sorted from poorest to richest. Median income provides a good indication of the standard of living of the “typical” individual in terms of income.
Gini coefficient
The Gini coefficient is one of the most widely used measures. It takes values between 0% and 100%, with higher values representing an increase in the level of inequality. A value of 0% indicates complete equality in the distribution of household income, implying that all people have the same equivalised income. A value of 100% indicates complete inequality, implying that one person has all the income and the others have no income.
P90/P10
The ratio of the income of the individual at the bottom of the top decile (or 10%) to that of the person at the top of the bottom decile.
S80/S20
The ratio of the total income received by the 20% of people with the highest income to that received by the 20% with the lowest income.
Palma ratio
The ratio of the income share of the richest 10% of people to that of the poorest 40%.
Back to table of contents6. Measuring these data
This release provides headline estimates of average disposable income. This year, for the first time, estimates have been calculated using a new combined data source, Household Finances Survey data. These data are derived from a combination of the Living Costs and Food Survey (LCF) and the Survey on Living Conditions giving us a voluntary sample survey of around 17,000 private households in the UK. More information about the impact of this change in data source can be found in Improving the measurement of household income.
These statistics are assessed fully compliant with the Code of Practice for Statistics and are therefore designated as National Statistics.
More quality and methodology information on strengths, limitations, appropriate uses, and how the data were created is available in the Effects of taxes and benefits on household income QMI.
Retired and non-retired households
This bulletin presents analysis examining the incomes of people who live in retired households. A retired household is one where more than 50% of its income is sourced from retired people. A retired person requires satisfying one of the following criteria:
their self-defined employment status is “Retired”, and they are aged over 50 years
their self-defined employment status is “Sick/Injured”, not seeking work and aged at or above the State Pension Age (SPA)
As such, analysis of the average income of people living in retired households can include much younger people and potentially exclude older people. However, the strength of this measure is that it highlights those individuals who are most likely to be affected by policy, societal or economic changes that disproportionately impact upon pension income.
Transformation of data
The Office for National Statistics (ONS) has been working on transforming its data on the distribution of household finances. The first part of this work concentrated on combining the samples from the LCF and another of ONS's household surveys, the Survey on Living Conditions (SLC), and harmonising the income collection in these questionnaires. This has resulted in a dataset formed of a sample of around 17,000 households. This year, for the first time, estimates have been calculated using this new combined data source; Household Finances Survey data. Estimates for financial year ending (FYE) 2018 and FYE 2019 will be revised to incorporate these new data.
The ONS is currently conducting research into making more use of administrative data on income, including Department for Work and Pensions (DWP) benefits data and HM Revenue and Customs (HMRC) tax data. Although these other sources have their own limitations, by using them together with surveys we should be able to improve how we measure household income. In particular, administrative data are likely to help address limitations in survey-based statistics, discussed in more detail in the strengths and limitations section such as under-reporting at the top and bottom of the income distribution, and enable analysis at lower geographic levels.
Over the next year, the ONS plans to publish research using linked administrative and survey data to compare administrative and survey measures for the main income components and continue to develop our experimental Admin-based income statistics.
Back to table of contents7. Strengths and limitations
An important strength of these data is that comparable estimates are available back to 1977, allowing analysis of long-term trends. This release also currently provides the earliest survey-based analysis of the household income distribution available each year, allowing people insight into the evolution of living standards as early as possible.
However, as with all survey-based sources, the data are subject to some limitations. For instance, the Household Finances Survey (HFS) is a sample of the private household population, and therefore does not include those that live in institutionalised households, such as care homes and hostels, or the homeless. As such, it is likely that many of the poorest in society are not captured, which users should bear in mind when interpreting these statistics.
In addition, household income surveys are known to suffer from under-reporting at the top and bottom of the income distribution. While an adjustment to address survey under-coverage of the richest people has been introduced for statistics covering financial year ending (FYE) 2002 onwards, reported in more detail in Top income adjustment in effects of taxes and benefits data: methodology, measurement issues at the bottom remain (see the Effects of taxes and benefits on household income QMI for further details of the sources of error).
Table 11 and Table 32 provide estimates of uncertainty for many headline measures of average income and income inequality.
The Department for Work and Pensions (DWP) also produces an analysis of the UK income distribution in its annual Households below average income (HBAI) publication, using data from its Family Resources Survey (FRS).
Back to table of contents