Table of contents
1. Introduction
This publication presents the results of the 2014-based population projections produced by the Office for National Statistics (ONS) for the UK and its constituent countries. These results were previously published in statistical releases 2014-based Statistical Bulletin on 29 October 2015 and 2014-based extra variants report on 26 November 2015. This volume is the latest in a regular series, which started in 1970, and brings together a summary of the results and details of the methodology into one compendium.
This volume includes some alternative summary charts and tables to those published previously. It also provides further detail of the projections methodology, some discussion around the trends which informed the assumptions and a range of related references for further background reading.
The following chapters are included:
- Chapter 1 - Background and methodology
- Chapter 2 - Summary results
- Chapter 3 - Fertility assumptions
- Chapter 4 - Mortality assumptions
- Chapter 5 - Migration assumptions
- Chapter 6 - Variants
Main points
At mid-2014 the estimated population of the UK was about 86,000 higher than that projected for mid-2014 in the 2012-based projections. This was predominantly due to higher levels of net migration observed in 2013 to 2014 than assumed in the 2012-based projections. More information comparing the 2014-based and 2012-based projections is available in the Summary Results chapter of the 2014-based national population projections release.
The main points of the 2014-based population projections are:
the UK population is projected to increase by 9.7 million over the next 25 years, from an estimated 64.6 million in mid-2014 to 74.3 million in mid-2039
the UK population is projected to reach 70 million by mid-2027
over the 10 year period to mid-2024, the UK population is projected to increase by 4.4 million to 69.0 million - this is 249,000 higher than the previous (2012-based) projection for that year
assumed net migration accounts for 51% of the projected increase over the next 25 years, with natural increase (more births than deaths) accounting for the remaining 49% of growth
2. Projected UK population change
The projection has the following features:
- the population is projected to continue ageing, with the average (median) age rising from 40.0 years in mid-2014 to 40.9 years in mid-2024 and 42.9 by mid-2039
- by mid-2039, more than 1 in 12 of the population is projected to be aged 80 or over.
- the number of children (those aged 0 to 15) is projected to grow by 8.8% between mid-2014 and mid-2039
- the number of people of working age (those aged between 16 and State Pension Age) is projected to rise by 11.4%, from 40.0 million in mid-2014 to 44.6 million by mid-2039
- the number of people of pensionable age for every thousand people of working age is projected to fall from 310 in mid-2014 to 284 in mid-2020 as a result of changes in the State Pension Age, but then rise to 370 in mid-2039 - this rise means that the projections show more people of pensionable age relative to the number of people of working age in mid-2039 than in mid-2014
The change in the age distribution between mid-2014 and mid-2039 is shown in Figure 0.1.
Figure 0.1: Estimated and projected age structure of UK population, mid-2014 and mid-2039
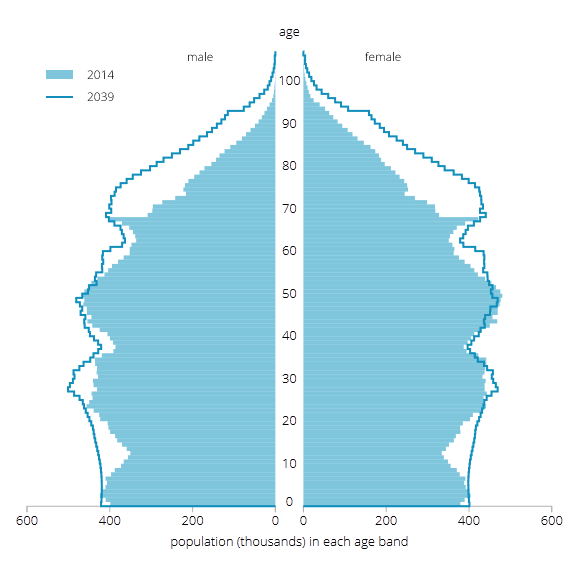
Source: Office for National Statistics
Notes:
- Ages above 105 are not included on the population pyramid
Download this image Figure 0.1: Estimated and projected age structure of UK population, mid-2014 and mid-2039
.PNG (102.8 kB) .xls (34.3 kB)
Table 0.1: Estimated and projected population by age, UK, mid-1981 to mid-2089
| thousands | |||||
| Year | All ages | Under 16 | 16-64 | 65 & over | (80 & over) |
| Estimates | |||||
| 1981 | 56,357 | 12,543 | 35,339 | 8,476 | 1,572 |
| 1991 | 57,439 | 11,685 | 36,695 | 9,059 | 2,126 |
| 2001 | 59,113 | 11,863 | 37,877 | 9,373 | 2,459 |
| 2011 | 63,285 | 11,883 | 40,944 | 10,458 | 2,915 |
| 2014 | 64,597 | 12,153 | 41,037 | 11,407 | 3,071 |
| Projections | |||||
| 2019 | 66,928 | 12,741 | 41,718 | 12,468 | 3,433 |
| 2024 | 69,036 | 13,105 | 42,206 | 13,725 | 3,962 |
| 2034 | 72,721 | 13,188 | 42,558 | 16,974 | 5,614 |
| 2039 | 74,284 | 13,219 | 43,013 | 18,053 | 6,259 |
| Longer-term projections | |||||
| 2044 | 75,766 | 13,380 | 43,842 | 18,544 | 7,137 |
| 2054 | 78,510 | 13,942 | 44,644 | 19,924 | 8,458 |
| 2064 | 80,992 | 14,198 | 45,606 | 21,188 | 8,908 |
| 2074 | 83,670 | 14,428 | 47,142 | 22,101 | 10,060 |
| 2084 | 86,546 | 14,836 | 47,990 | 23,720 | 10,690 |
| 2089 | 87,984 | 15,010 | 48,438 | 24,536 | 11,189 |
| Source: Office for National Statistics | |||||
| Notes: | |||||
| 1. Figures may not sum due to rounding | |||||
Download this table Table 0.1: Estimated and projected population by age, UK, mid-1981 to mid-2089
.xls (28.2 kB)Due to differences in past and present demographic patterns, and those assumed for the future, projected trends differ for the 4 countries of the UK (see Table 0.2).
The population of England is projected to increase by 16.5%, Wales by 6.1%, Scotland by 6.6% and Northern Ireland by 9.8% over the 25 year period to mid-2039.
Table 0.2: Estimated and projected population of the UK by constituent country, mid-1981 to mid-2064
| thousands | |||||
| Year | UK | England | Wales | Scotland | Northern Ireland |
| Estimates | |||||
| 1981 | 56,357 | 46,821 | 2,813 | 5,180 | 1,543 |
| 1991 | 57,439 | 47,875 | 2,873 | 5,083 | 1,607 |
| 2001 | 59,113 | 49,450 | 2,910 | 5,064 | 1,689 |
| 2011 | 63,285 | 53,107 | 3,064 | 5,300 | 1,814 |
| 2014 | 64,597 | 54,317 | 3,092 | 5,348 | 1,840 |
| Projections | |||||
| 2019 | 66,928 | 56,466 | 3,139 | 5,428 | 1,894 |
| 2024 | 69,036 | 58,396 | 3,187 | 5,514 | 1,939 |
| 2034 | 72,721 | 61,800 | 3,262 | 5,659 | 2,000 |
| 2039 | 74,284 | 63,282 | 3,280 | 5,701 | 2,021 |
| Longer-term projections | |||||
| 2044 | 75,766 | 64,702 | 3,294 | 5,732 | 2,039 |
| 2054 | 78,510 | 67,373 | 3,314 | 5,767 | 2,057 |
| 2064 | 80,992 | 69,801 | 3,338 | 5,798 | 2,055 |
| Source: Office for National Statistics | |||||
| Notes: | |||||
| 1. Figures may not sum due to rounding | |||||
Download this table Table 0.2: Estimated and projected population of the UK by constituent country, mid-1981 to mid-2064
.xls (28.2 kB)3. Underlying assumptions
The national population projections are based on the latest available mid-year population estimates and a set of demographic assumptions about future fertility, mortality and migration based on analysis of trends and expert advice. The main assumptions for the UK as a whole are set out below.
Average completed family size, which has been falling from a peak of nearly 2.5 children per woman for women born in the mid-1930s, is assumed to level off at 1.89 children for women born after 2010. This is the same assumption as the 2012-based projection. It is projected that this assumption will hold true for women born after 2015.
Expectation of life at birth, based on mortality rates for the year in question, is projected to increase from 78.9 years in mid-2015 to 84.1 years in mid-2039 for males, and from 82.5 years in mid-2015 to 86.9 years in mid-2039 for females. In mid-2039, period expectation of life at birth for the UK is around 0.2 years lower for males and 0.6 years lower for females compared with the previous projections. These projected life expectancies are lower as a result of recent mortality rates. After 2039, the life expectancies continue to diverge from those in the 2012-based projections to approximately 0.6 years lower for males and 1.0 years lower for females by the end of the 100 year projection period.
The long-term assumption for net migration to the UK is +185,000 each year, compared with +165,000 per year in the 2012-based projections. This change reflects the most recent trends in international migration available at the time the projections were produced. A new method for setting and applying the cross-border (intra-UK) migration assumptions as rates rather than fixed numbers of migrants was introduced and applied for the 2014-based projections (see Chapter 5).
Back to table of contents