
1. Introduction
This report provides detailed information on the principal and variant fertility assumptions used in the 2014-based national population projections. For England and for Wales, the long-term average completed family size is assumed to be 1.90 children per woman. A higher level of 2.00 is assumed for Northern Ireland and a lower level of 1.70 is assumed for Scotland. The long-term completed family size assumptions for England, Wales and Northern Ireland have seen no change from those used in the 2012-based projections, however the assumption for Scotland has been reduced from 1.75 to 1.70.
Completed Family Size is the average number of live-born children per woman which a group of women born in the same year have had by the end of their childbearing years. In general, measurement and analysis of fertility in terms of women born in a particular year is referred to as cohort fertility.
The age-specific fertility rate (ASFR) is the average number of children per woman, born to a group of women of a particular age in a particular year, normally expressed per thousand women.
The total period fertility rate (TPFR) is the average number of children per woman that would be born to a group of women if they experienced the current year's age-specific fertility rates for each year of their childbearing years. This measure is referred to as the total fertility rate, or TFR, in this Report.
Back to table of contents2. Principal assumptions
The numbers of births for the projections are obtained by applying the appropriate fertility rate to the number of women at each age during each year of the projection period. Because cohort fertility rates are more stable than those for calendar years (period rates), the fertility rates used in the projections are derived from assumptions relating to the year in which women were born.
The assumptions about completed family size are based on family-building patterns to date and other relevant evidence. Discussion papers showing the background information used in setting the fertility assumptions are available.
Tables 3.1 to 3.3 show average completed family size, births per 1,000 women, achieved family size, and average age at motherhood, by year of birth of woman.
Table 3.1: Completed family size for the constituent countries of the UK
| Year of birth of woman | ||||||||||||||
| 1950 | 1955 | 1960 | 1965 | 1970 | 1975 | 1980 | 1985 | 1990 | 1995 | 2000 | 2005 | 2010 | 2015 & later | |
| England | 2.06 | 2.02 | 1.98 | 1.91 | 1.91 | 1.92 | 2.00 | 2.01 | 2.00 | 1.92 | 1.90 | 1.90 | 1.90 | 1.90 |
| Wales | 2.10 | 2.05 | 1.99 | 1.96 | 1.94 | 1.93 | 1.96 | 1.99 | 1.99 | 1.91 | 1.90 | 1.90 | 1.90 | 1.90 |
| Scotland | 2.08 | 1.95 | 1.87 | 1.80 | 1.74 | 1.72 | 1.74 | 1.75 | 1.71 | 1.66 | 1.68 | 1.70 | 1.70 | 1.70 |
| Northern Ireland | 2.87 | 2.65 | 2.42 | 2.22 | 2.11 | 2.00 | 2.11 | 2.07 | 2.04 | 2.00 | 2.00 | 2.00 | 2.00 | 2.00 |
| United Kingdom | 2.09 | 2.03 | 1.98 | 1.91 | 1.91 | 1.91 | 1.98 | 1.99 | 1.98 | 1.90 | 1.89 | 1.89 | 1.89 | 1.89 |
| Source: Office for National Statistics Note: Figures from 1975 to 2015 and later are partly or wholly projected | ||||||||||||||
Download this table Table 3.1: Completed family size for the constituent countries of the UK
.xls (26.6 kB)
Table 3.2: Births per 1,000 women by age, UK
| Year of birth of woman | ||||||||||||||
| Ages | 1950 | 1955 | 1960 | 1965 | 1970 | 1975 | 1980 | 1985 | 1990 | 1995 | 2000 | 2005 | 2010 | 2015 and later |
| Under 20 | 231 | 221 | 156 | 133 | 152 | 147 | 154 | 135 | 127 | 88 | 73† | 72† | 71† | 71† |
| 20 - 24 | 699 | 561 | 527 | 457 | 418 | 361 | 346 | 357 | 338 | 284† | 283† | 281† | 281† | 281† |
| 25 - 29 | 634 | 650 | 630 | 594 | 522 | 469 | 498 | 513 | 504† | 507† | 508† | 509† | 509† | 509† |
| 30 - 34 | 365 | 403 | 438 | 454 | 466 | 533 | 556 | 549† | 564† | 572† | 574† | 574† | 575† | 575† |
| 35 - 39 | 132 | 163 | 190 | 216 | 276 | 316 | 338† | 348† | 354† | 360† | 361† | 361† | 361† | 361† |
| 40 and over | 28 | 36 | 43 | 57 | 71† | 80† | 88† | 90† | 91† | 91† | 92† | 92† | 92† | 92† |
| Total Fertility Rate | 2.09 | 2.03 | 1.98 | 1.91 | 1.91† | 1.91† | 1.98† | 1.99† | 1.98† | 1.90† | 1.89† | 1.89† | 1.89† | 1.89† |
| Source: Office for National Statistics | ||||||||||||||
| Note : | ||||||||||||||
| .† figures are partly or wholly projected | ||||||||||||||
Download this table Table 3.2: Births per 1,000 women by age, UK
.xls (73.7 kB)
Table 3.3: Achieved family size by exact age, and average age at motherhood, UK
| Year of birth of woman | ||||||||||||||
| Ages | 1950 | 1955 | 1960 | 1965 | 1970 | 1975 | 1980 | 1985 | 1990 | 1995 | 2000 | 2005 | 2010 | 2015 & later |
| 20 | 0.23 | 0.22 | 0.16 | 0.13 | 0.15 | 0.15 | 0.15 | 0.14 | 0.13 | 0.09 | 0.07† | 0.07† | 0.07† | 0.07† |
| 25 | 0.93 | 0.78 | 0.68 | 0.59 | 0.57 | 0.51 | 0.50 | 0.49 | 0.47 | 0.37† | 0.36† | 0.35† | 0.35† | 0.35† |
| 30 | 1.56 | 1.43 | 1.31 | 1.18 | 1.09 | 0.98 | 1.00 | 1.01 | 0.97† | 0.88† | 0.86† | 0.86† | 0.86† | 0.86† |
| 35 | 1.93 | 1.84 | 1.75 | 1.64 | 1.56 | 1.51 | 1.55 | 1.55† | 1.53† | 1.45† | 1.44† | 1.44† | 1.44† | 1.44† |
| 40 | 2.06 | 2.00 | 1.94 | 1.85 | 1.83 | 1.83 | 1.89† | 1.90† | 1.89† | 1.81† | 1.80† | 1.80† | 1.80† | 1.80† |
| 45 | 2.09 | 2.03 | 1.98 | 1.91 | 1.90 | 1.90† | 1.97† | 1.99† | 1.97† | 1.90† | 1.88† | 1.88† | 1.88† | 1.88† |
| Total family size | 2.09 | 2.03 | 1.98 | 1.91 | 1.91 | 1.91† | 1.98† | 1.99† | 1.98† | 1.90† | 1.89† | 1.89† | 1.89† | 1.89† |
| Mean age at motherhood (years) | 26.4 | 27.1 | 27.8 | 28.4 | 28.9 | 29.5† | 29.7† | 29.7† | 29.9† | 30.4† | 30.5† | 30.6† | 30.6† | 30.6† |
| Source: Office for National Statistics Note: 1.† figures are partly or wholly projected. | ||||||||||||||
Download this table Table 3.3: Achieved family size by exact age, and average age at motherhood, UK
.xls (83.5 kB)The equivalent tables for the constituent countries of the UK, England and Wales, and Great Britain can be found in the data download links.
For the UK as a whole, completed family size showed a sharp decline from an average of around 2.45 children for women born in the mid-1930s to just over 2.0 for women born in the 1950s. Since then, the completed family size has declined gradually, with women born in 1968, effectively the most recent cohort to have completed their fertility, achieving an average of 1.9 children per woman.
The family sizes to be achieved by women currently in their twenties or younger are highly conjectural, but there is some evidence that suggests falls in cohort fertility could be slowing down. In particular, women born in 1980 have had more children on average by age 30 than those born in 1975 and because fertility rates at older ages are projected to remain high, the 1980 cohort is projected to have 1.98 children on average, a higher completed family size than women born in the 1970s. For women born after 1980, it has been assumed that average completed family size for the UK as a whole will fluctuate before falling and stabilising at 1.89 children for women born after 2015.
For England and for Wales, the long-term average completed family size is assumed to be 1.90 children per woman. A higher level of 2.00 is assumed for Northern Ireland and a lower level of 1.70 is assumed for Scotland. These assumptions see no change compared with the 2012-based projections for Northern Ireland, England and Wales, however, the assumption for Scotland has been reduced by 0.05.
Between 2002 and 2008, total fertility rates increased in all constituent countries of the UK, followed by a dip in 2009 (see Figure 3.1). Whilst Scotland showed a steady decline between 2009 and 2012, England, Wales and Northern Ireland showed small fluctuations in total fertility rate year on year. Between 2012 and 2013, the total fertility rate for all countries showed a large drop followed by smaller changes in 2014. For the UK, the fall was 1.92 to 1.83 between 2012 and 2013, with a rate of 1.82 in 2014. For the latest projections, it is assumed there will be a gradual upward trend in the UK fertility rate before levelling out at 1.89 in the long-term.
Over the past 10 years, fertility rates have generally been rising faster among women in their thirties and forties than for women in their twenties, so mean age at childbirth has continued to rise. The average age at motherhood for the UK as a whole is projected to increase from 28.4 years for women born in 1965 to its long-term level of 30.6 years for those born from 2015 onwards.
Figure 3.1 shows the total fertility rate (TFR) and average completed family size (CFS) for the UK between 1973 and 2039.
Figure 3.1: Total fertility rate and average completed family size, UK, 1973 to 2039

Source: Source: Office for National Statistics
Notes:
- All fertility data are displayed on a calendar year basis
- Completed family size (CFS) relates to cohort born 30 years earlier - 30 years being the approximate mid-point of the childbearing ages. Projected completed family size is given for cohorts who have not yet completed childbearing
- Replacement fertility is the level of fertility required for the population to replace itself in size in the long term. In the UK, women would need to have, on average, 2.075 children to ensure long term ‘natural’ replacement of the population
Download this image Figure 3.1: Total fertility rate and average completed family size, UK, 1973 to 2039
.png (18.1 kB) .xls (31.7 kB)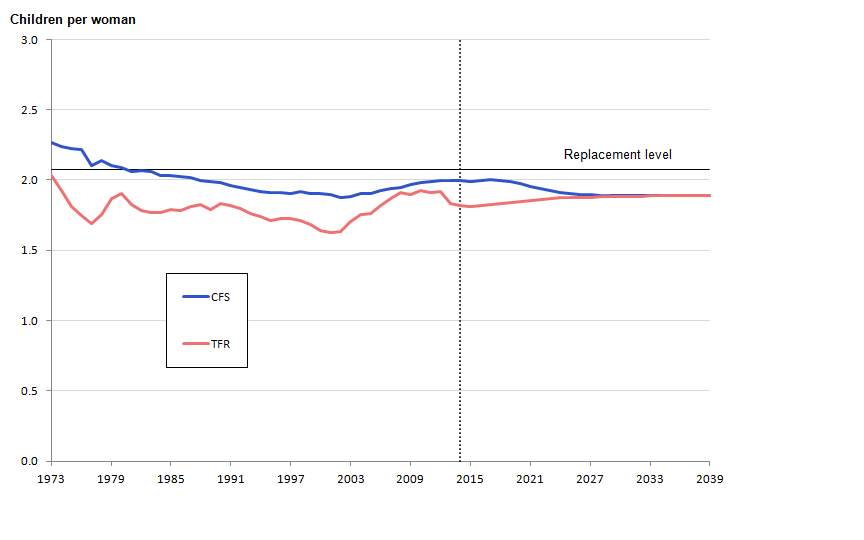
Figure 3.2 shows the assumed ultimate (long-term) age-specific fertility rates for the constituent countries of the UK.
Figure 3.2: Assumed ultimate (long-term) age-specific fertility rates, UK constituent countries
Source: Office for National Statistics
Notes:
- All fertility data are displayed on a calendar year basis
Download this chart Figure 3.2: Assumed ultimate (long-term) age-specific fertility rates, UK constituent countries
Image .csv .xlsFigure 3.3 shows the estimated and assumed average completed family size for women born between 1943 and 2009 for the constituent countries of the UK.
Figure 3.3: Estimated and assumed average completed family size, women born 1943 to 2009, UK constituent countries
Source: Office for National Statistics, National Records of Scotland, Northern Ireland Statistics and Research Agency
Notes:
- All fertility data are displayed on a calendar year basis
- Replacement fertility is the level of fertility required for the population to replace itself in size in the long term. In the UK, women would need to have, on average, 2.075 children to ensure long term ‘natural’ replacement of the population
Download this chart Figure 3.3: Estimated and assumed average completed family size, women born 1943 to 2009, UK constituent countries
Image .csv .xlsFigure 3.4 shows the estimated and assumed total fertility rates for the constituent countries of the UK between 1973 and 2039.
Figure 3.4: Estimated and assumed total fertility rates, 1973 to 2039, UK constituent countries

Source: Office for National Statistics, National Records of Scotland, Northern Ireland Statistics and Research Agency
Notes:
- All fertility data are displayed on a calendar year basis.
- Replacement fertility is the level of fertility required for the population to replace itself in size in the long term. In the UK, women would need to have, on average, 2.075 children to ensure long term ‘natural’ replacement of the population.
Download this image Figure 3.4: Estimated and assumed total fertility rates, 1973 to 2039, UK constituent countries
.png (26.2 kB) .xls (34.8 kB)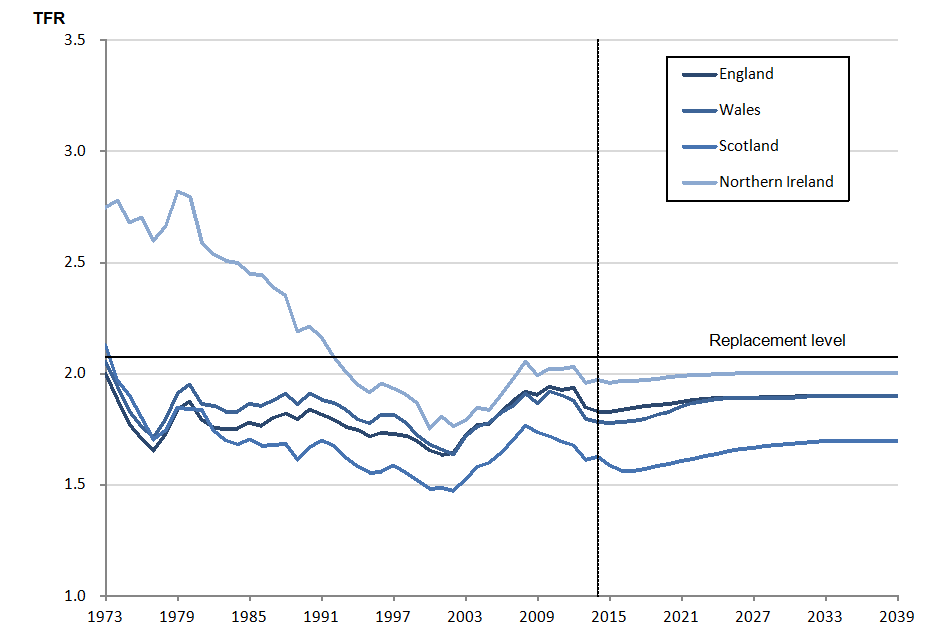
3. Assumptions for fertility variants
Table 3.4 shows the assumed long-term total fertility rates for the standard variants for the UK and its constituent countries.
Table 3.4: Assumed long-term total fertility rates for the standard variants
| Standard variants | |||
| Country | High | Principal | Low |
| England | 2.10 | 1.90 | 1.70 |
| Wales | 2.10 | 1.90 | 1.70 |
| Scotland | 1.90 | 1.70 | 1.50 |
| Northern Ireland | 2.20 | 2.00 | 1.80 |
| United Kingdom | 2.09 | 1.89 | 1.69 |
| Source: Office for National Statistics | |||
Download this table Table 3.4: Assumed long-term total fertility rates for the standard variants
.xls (52.7 kB)For the standard variants, fertility rates are generally assumed to move gradually from current levels to those assumed for the long-term.
Figure 3.5 shows estimated and assumed total fertility rates for the UK between 1973 and 2039 for the principal projection and high and low variants.
Figure 3.5: Estimated and assumed total fertility rates, UK, 1973 to 2039
Source: Office for National Statistics
Notes:
- Replacement fertility is the level of fertility required for the population to replace itself in size in the long term. In the UK, women would need to have, on average, 2.075 children to ensure long term ‘natural’ replacement of the population
- All fertility data are displayed on a calendar year basis
Download this chart Figure 3.5: Estimated and assumed total fertility rates, UK, 1973 to 2039
Image .csv .xlsThe equivalent charts for the constituent countries of the UK can be found in the relevant appendices.
Different scenarios involving both replacement fertility and constant fertility are discussed in further detail in our second release, the 2014-based extra variants report which is being published on 26 November 2015.
Back to table of contents