1. Main points
The latest update of the Measuring of National Well-being programme provides a broadly positive picture of life in the UK, with most indicators either improving or staying the same over the short-term (one year) and long-term (five years).
Younger people (mainly aged 16 to 24) were more likely to report higher ratings of satisfaction with their health and engage in physical activities.
The main challenges for younger people include unemployment, loneliness, having someone to rely on and a lack of sense of belonging to their neighbourhood.
People in their early and middle years (mainly aged 25 to 54) were generally more likely to be in employment, but less likely to be satisfied with their leisure time.
Older people (mainly aged 75 and over) were more likely to be satisfied with their income, leisure time, feel they can cope financially and belong to their neighbourhood.
The main challenges for older people are lower satisfaction with their health and lower engagement with an art or cultural activity.
2. Statistician’s comment
“There is a growing recognition that how we are doing as a nation is at least as much about people’s well-being as it is about the country’s economic health. Today’s analysis shows the strengths and challenges of different age groups in society. These insights can help target services where they are most needed and can have the best impact”.
Silvia Manclossi, Head of Quality of Life Team, Office for National Statistics
Back to table of contents3. Things you need to know about this release
Measuring National Well-being programme
In November 2010, the Measuring National Well-being (MNW) programme was established. The aim was to monitor and report “how the UK is doing” by producing accepted and trusted measures of the well-being of the nation. Twice a year we report progress against a set of headline indicators covering areas of our lives including our health, natural environment, personal finances and crime.
The measures include both objective data (for example, unemployment rate) and subjective data (for example, satisfaction with job) to provide a more complete view of the nation’s progress than economic measures such as gross domestic product (GDP) can do alone.
This release is based on the most recent available data as of April 2018. It is important to note that the data underpinning the indicators are often from different sources with different timeliness and coverage. Data is mainly taken from household surveys and they help understand the well-being of those living in private residential households. People living in communal establishments (such as care homes) or other situations are not represented in these surveys and this may be important in interpreting the findings in relation to older age groups. For example, according to the report Changes in the Older Resident Care Home Population between 2001 and 2011, more than a quarter of a million (291,000) people aged 65 and over were living in care homes in England and Wales in 2011. This represented 3.2% of the total population at this age.
Assessment of change and well-being interactive dashboard
This article forms part of the MNW programme which today publishes the latest data, time series data and detailed information on the measures of national well-being along with the last assessments of change. The assessments show the direction of change for each of the measures, whether they have improved, shown no overall change, or deteriorated.
Comparisons have been made in the short-term with the previous year’s data, or the previously published figure where year-on-year data are not available, as well as an assessment of change over a longer term (mainly over a five-year period). Compared with the previous reporting period, the longer-term assessment of change has been increased from three to five years as we now have longer time-series for many of the measures which will enable a better assessment of change over time.
Broadly speaking, indicators have only been assessed as having improved or deteriorated if the difference between the comparison periods is statistically significant using 95% confidence intervals. If a difference is said to be statistically significant, it is unlikely that it could have occurred by chance. Alongside this release, we have also published:
the national well-being domains and measures dataset containing the latest data and back series, the indicators broken down by age, sex and region where applicable; and quality information
an interactive dashboard showing trend data for each indicator alongside the assessment of change, compared with one year earlier
Example of the indicators on the Measuring National Well-being dashboard

Download this image Example of the indicators on the Measuring National Well-being dashboard
.png (55.4 kB)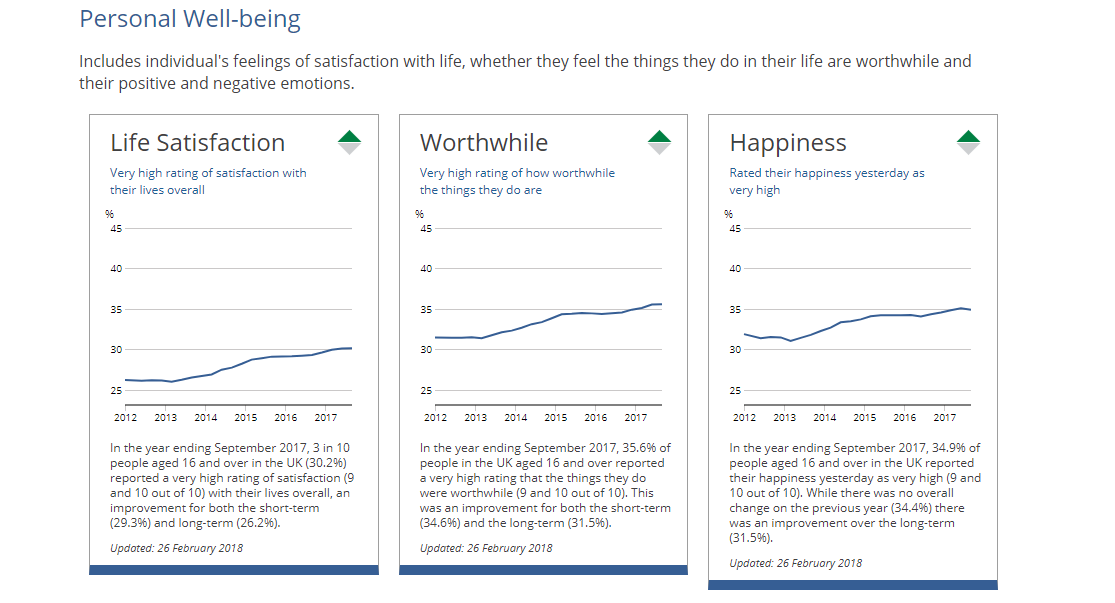
We regularly review our indicators in response to changing coverage, frequency and other quality considerations affecting our data sources. Changes have been made to the sports participation measure as shown in Table 1.
Table 1: Summary of removed indicator and its replacement
| Removed Indicator | Source | Reason |
|---|---|---|
| 4.6 Adult participation in 30 mins of moderate intensity sport, once per week. | Active People Survey, Sport England | Change of survey |
| Replacement indicator | Source | |
| 4.6 Percentage who have taken part in at least 150 minutes of sport and physical activities a week | Active Lives Survey, Sport England | |
| Source: Office for National Statistics | ||
Download this table Table 1: Summary of removed indicator and its replacement
.xls (32.3 kB)Age-group analysis
A full breakdown of age-group data is provided in the national well-being domains and measures dataset. It should be noted that, while this article looks at age-group comparisons for those aged 16 and over, we have also published more detailed datasets focusing on children’s well-being and young people’s well-being.
The analysis in this article uses harmonised age groups (Principle 3 or 4) as specified in Harmonised Concepts and Questions for Social Data Sources - Introduction to Harmonised Standards.
Our next publications and your feedback
We are in the process of reviewing our national well-being indicators and how we publish these data. You can help inform our work by sharing your opinions in this short survey – ONS Measuring National Well-being outputs: Your feedback.
Your feedback will be very valuable in making our results useful and accessible. If you have any questions, please contact us via email at QualityOfLife@ons.gov.uk.
Thank you for taking part!
Back to table of contents4. Well-being for all ages?
The age structure of the UK’s population is changing, with many people having fewer children, and living longer lives. As a result (like many other countries) the population of the UK is getting older. Latest estimates show that there were 11.8 million UK residents aged over 65, representing 18% of the population. 25 years ago, this was 15.6% and in 25 years’ time it is projected to make up a quarter of the UK population. This demographic change will affect everyone and have implications for many different areas of life such as the provision of services, the economy and society.
The Measuring National Well-being (MNW) programme has traditionally focused mainly on headline figures for the whole population. This method of presenting overall population averages gives a good sense of the broad trajectory for the nation, but may mask important differences in the well-being of different groups within the population. To increase the value of our work to decision makers and in keeping with our aspiration to “leave no one behind”, we are taking a new approach and looking beneath the overall figures to understand how people of different ages are faring in the UK today. Understanding more about how people of different ages experience life based on a broad range of measures can help highlight who is thriving and who is struggling in different aspects of life. This in turn is very important in assessing how sustainable our currently high levels of national well-being may be in the future.
This year, we are establishing a Centre of Expertise on Ageing and Demography, which will set out our ambition for a comprehensive and coherent workplan for improving the evidence on the impacts of an ageing population. We will also be establishing a Centre of Expertise for Inequalities. The aim of this centre will be to ensure that the right data are available to address the main social and policy questions about fairness and equity in our society, that the relevant analysis is taken forward and that we are using the most appropriate methods. Both these centres will involve partnerships across government, academia and other organisations to identify where better evidence is needed and to make better use of new and existing data sources.
This article provides a snapshot of how people of different ages are faring in the UK today across a range of measures of national well-being where age group data are available. Of the 43 measures of national well-being, data for age groups are collected for just under half. These are mostly contained within the “Social” domains such as “Personal well-being”, “Our relationships”, “Health” and “What we do”. Comparisons between groups are highlighted only where they are statistically significant. The article draws on the latest data available for the UK unless otherwise specified.
Personal well-being
Personal well-being is a subjective assessment of how people feel about their own lives. Our measures of personal well-being focus on overall satisfaction with life, the extent to which we feel the things we do are worthwhile and daily emotions such as happiness and anxiety. These measures are strongly related to other important aspects of quality of life such as our health, relationships and employment. In the year ending September 2017, 30.2% of people aged 16 and over reported a very high rating of satisfaction with their life overall, 35.6% a very high rating of how worthwhile they feel the things they do are, 34.9% rated their happiness yesterday as very high and 39.9% rated their anxiety yesterday as very low.
Overall, from about the age of 65 until at least our mid-70s, levels of personal well-being look very positive. People in this age range give higher ratings that the things they do are worthwhile and higher happiness ratings on average than younger age cohorts. Specifically, looking at responses to the four personal well-being questions between October 2016 and September 2017:
a higher proportion of those aged 16 to 19 and those aged 65 and over reported a high level of life satisfaction (9 to 10 out of 10) than those aged 20 to 24 and 30 to 59
a higher proportion of those aged 65 to 79 reported a high level of worthwhile (9 to 10 out of 10) than those aged 16 to 64
a higher proportion of those aged 65 to 84 reported a high level of happiness (9 to 10 out of 10) than all those aged 16 to 64
a lower proportion of those aged 16 to 24 reported a low level of ‘anxiety yesterday’ (0 to 1 out of 10) than those aged 65 to 89
Previous research has suggested that the relationship between age and aspects of personal well-being is U-shaped (David G. Blanchflower, Andrew J. Oswald, 2008). That is, our sense of personal well-being is highest among younger people and older people and is lowest among people in their middle years. The article At what age is Personal Well-being the highest? has provided a more detailed picture of the relationship between personal well-being and age than the widely accepted U-curve and found a notable decline in personal well-being scores for those aged 75 and over.
Apart from our own assessments of how life is going, we also look at measures of mental well-being. In contrast to mental ill-health, mental well-being focuses on whether people are feeling and functioning well. It has been described as “a dynamic state, in which the individual is able to develop their potential, work productively and creatively, build strong and positive relationships with others, and contribute to their community” (Foresight report, 2008).
We measure mental well-being using the Short Warwick-Edinburgh Mental Well-being Scale. This gives an indication of population mental well-being including psychological functioning and affective emotional responses. Adults aged 16 and over complete a seven-question survey and each response is given a score of between 1 and 5, resulting in a total score of between 7 and 35. A higher score indicates higher mental well-being. Between 2015 and 2016, the average score for all adults aged 16 and over was 25.2. The average scores ranged from 24.7 for those aged 25 to 44 and 26.4 for those aged 65 to 74. Those aged 75 and over had an average score of 25.9, which was higher than all other age groups (apart from those aged 65 to 74).
Our relationships
Our personal relationships form the foundations of our social support networks and are important for both individual and community well-being. Having someone to rely on in times of adversity can help us cope better and be more resilient. In 2013 to 2014, 84.0% of people aged 16 and over reported having a spouse or partner, family member or friend to rely on if they had a serious problem. Of those aged 75 and over, 88.7% reported having someone to rely on, a higher proportion than all other age groups (except those aged 65 to 74). The age group with the lowest proportion reporting having someone to rely on (76.2%) were those aged 16 to 24.
Related to a sense of social support, loneliness is another important issue which can have an important impact on our quality of life. Recent research notes that: “Feelings of loneliness are most strongly associated with poor mental health, but are also associated with long-term problems of stress, anxiety and depression. Research shows that lacking social connections is as damaging to our health as smoking 15 cigarettes a day” (Holt-Lunstad, 2015).
ONS have recently published an article, Loneliness – What characteristics and circumstances are associated with feeling lonely?, which focused on identifying personal characteristics and circumstances which increase or reduce the likelihood of experiencing loneliness. The findings showed that, when all other factors are held constant, the likelihood of being lonely tends to decrease with age. In the financial year ending 2017, 5.4% of people aged 16 and over in England reported feelings of loneliness either often or always. Over the same period, a higher proportion of those aged 16 to 24 reported feelings of loneliness either often or always (9.8%) compared with all other age groups. The proportion of those aged 75 and over who reported feelings of loneliness either often or always (2.9%) was significantly lower than those aged 16 to 34 and 50 to 64.
Health
Recent qualitative evidence published in the What Works Centre for Wellbeing Public Dialogues Report highlights that people believe good physical and mental health is at the heart of well-being. The World Health Organisation defines health holistically as "a state of complete physical, mental, and social well-being and not merely the absence of disease or infirmity". Using this approach, it follows that if an individual is in good health they are more likely to be in employment, to take up exercise and have an active social life, which in turn will improve their overall well-being.
Between 2015 and 2016, 51.0% of people aged 16 and over in the UK reported that they were mostly or completely satisfied with their health. The proportion of young people aged 16 to 24 who reported that they were mostly or completely satisfied with their health (59.5%) was higher than all other age groups. The fact that people tend to develop more health problems with increasing age is reflected in the finding that those aged 75 and over were least likely to say they were mostly or completely satisfied with their health (40.1%).
As well as assessing mental well-being, we also look at measures of mental ill health. Using the General Health Questionnaire (GHQ), a score of four or more indicates that an individual has symptoms of mild to moderate mental illness such as anxiety or depression. In 2015 to 2016, 17.8% of people aged 16 and over scored four or more on the GHQ. Broken down by age group, Figure 1 illustrates those aged 65 to 74 had the lowest frequency of mental illness using this measure, significantly below that of all other age groups. Those aged 75 and over also had a lower frequency of mental illness than those aged 16 to 64, but higher than those aged 65 to 74. Specifically, the proportions of people aged 65 to 74 and 75 and over who scored four or more were lower (12.2% and 15.1% respectively) than the proportions for the younger age groups, ranging from 17.9% for those aged 55 to 64 to 20.8% for those aged 16 to 24.
Figure 1: Proportion of people with some evidence indicating depression or anxiety1: by age, 2015 to 2016
UK
Source: Understanding Society the UK Household Longitudinal Study
Notes:
This uses the General Health Questionnaire (GHQ) which asks respondents 12 questions about their recent feelings (for more detail on the questions asked see link below). Once all 12 questions are scored, these scores are added so that each individual has a score which ranges from 0 to 12. A score of four or more has been shown to indicate that the individual has symptoms of mild to moderate illness such as anxiety or depression. A high score on the GHQ indicates that the respondent may have a mild to moderate mental illness.
95% confidence intervals are displayed on the chart as error bars.
Download this chart Figure 1: Proportion of people with some evidence indicating depression or anxiety^1^: by age, 2015 to 2016
Image .csv .xlsWhat we do
How we spend our time and how we feel about it is important both to our own individual well-being and to society generally. It underpins our choices in relation to work and learning, shaping our lifestyle, our relationships with others, our health, our financial security and our contributions to society in the form of work, volunteering and caring roles.
Focusing firstly on the relationship between employment and well-being, there is strong evidence showing that work is generally good for physical and mental health and well-being. By contrast, worklessness is associated with poorer physical and mental health outcomes and lower personal well-being. “Unemployment is one of the most important factors affecting individual wellbeing, with negative impacts going beyond the effects on income. When measuring life satisfaction on a 0-10 scale, the unemployed report about 0.5 points lower compared to those who are in employment” (What Works Centre for Wellbeing, 2017).
Recent unemployment figures highlight that younger people aged 16 to 24 are currently faring less well in the labour market than older age groups and have higher rates of unemployment. In December 2017 to February 2018, the unemployment rate for people aged 16 and over was 4.2%. When broken down by age, young people aged 16 to 17 and 18 to 24 had higher unemployment rates (26.9% and 10.3% respectively) than for those in the older age groups aged 25 to 49 (3.2%) and 50 and over (2.8%).
While unemployment has a negative effect on well-being, it is important to note that being employed in a job with which one is not satisfied can also have an adverse effect on well-being. A evidence review by the What Works Centre for Wellbeing, ‘Job quality and wellbeing’ found that “high quality” jobs – those that are secure, have good social connections, include the ability to use and develop our skills, have clear responsibilities and opportunities to have a say in a supportive workplace are significant for our well-being at work. If we move into a role with none, or fewer, of these elements, our life satisfaction drops.
Job satisfaction has been shown to be a strong predictor of overall individual well-being (Diaz-Serrano and Cabral Vieira, 2005). In 2015 to 2016, 55.5% of adults aged 16 and over (if in employment) reported that they were mostly or completely satisfied with their job. As Figure 2 highlights, those aged 65 and over were more likely than younger age groups to report higher job satisfaction, but it is important to note the smaller sample sizes for these age groups. Specifically, a higher proportion of those aged 75 and over and still working reported being satisfied with their jobs (86.7%) than all other age groups (except those aged 65 to 74). There is no significant difference in job satisfaction between people of traditional working age (between 16 and 64) but job satisfaction seems to be higher for those who have extended their working lives beyond 65.
Figure 2: Proportion of people who were mostly or completely satisfied with their job1: by age, 2015 to 2016
UK
Source: Understanding Society the UK Household Longitudinal Study
Notes:
Respondents were asked to rate their job satisfaction (if in employment) from "Completely dissatisfied" to "Completely satisfied". Responses for mostly and completely satisfied are included in the chart.
95% confidence intervals are displayed on the chart as error bars.
Download this chart Figure 2: Proportion of people who were mostly or completely satisfied with their job^1^: by age, 2015 to 2016
Image .csv .xlsConsidering the issue of life beyond work, we also look at how satisfied people are with their leisure time. In 2015 to 2016, 44.6% of people aged 16 and over reported being mostly or completely satisfied with their amount of leisure time. Across age groups, a higher proportion of young people aged 16 to 24 (47.0%) reported being mostly or completely satisfied with their amount of leisure time than those aged 25 to 54. Similarly, a higher proportion of older people aged 75 and over were mostly or completely satisfied with their amount of leisure time (70.7%) than all age groups between 16 and 64. Those aged 25 to 54 were less likely to report that they were satisfied with the amount of their leisure time than any other age group, probably due to work and family commitments.
Volunteering is another way in which we can contribute both to the well-being of others as well as ourselves. A report by the Cabinet Office, ‘Wellbeing and Civil Society’ highlights that “Volunteering is vital to charities and civil society, helps to strengthen local communities, and improves the wellbeing of individuals who participate”. The proportion of people volunteering has shown improvements in 2014 to 2015; 19.1% of those aged 16 and over had done some form of voluntary work more than once in the 12 months prior to interview, which included a quarter (24.9%) of those aged 65 to 74. This was a higher proportion than all other age groups. However, a recent publication, Changes in the value and division of unpaid volunteering in the UK: 2000 to 2015 found that the average time spent volunteering per day has fallen, except for those in the youngest age group of 16 to 24, who have increased the time they devote to volunteering. These publications looked at volunteering from different perspectives – one focusing on the frequency of volunteering while the other considered the time spent volunteering. Together, they suggest that, while engagement in volunteering has increased, time spent on volunteering has decreased. The article Billion pound loss in volunteering effort also found that, while the number of people volunteering had increased in recent years, the average time spent volunteering per day has fallen.
There is evidence that participation in both physical and non-physical leisure activities can increase general psychological well-being and life satisfaction and help to relieve stress (Haworth, 2010). Over 8 in 10 (82.2%) of people aged 16 and over in England reported that they had engaged with, or participated in, an arts or cultural activity at least three times in the financial year ending 2017. There was very little difference in the proportion for each age group reporting arts or cultural activity for those aged 16 to 74, however, those aged 75 and over had a significantly lower engagement rate compared to other age groups.
Recent research by Sport England reveals that active people are happier and more satisfied with their lives – and are less likely to experience anxiety. Between November 2016 and November 2017, 61.8% of people aged 16 and over in England reported participating in at least 150 minutes of sport and physical activities a week. Activity levels generally decrease with age; a higher proportion of those aged 16 to 24 reported participating in at least 150 minutes of sport and physical activities a week (74.9%) when compared with all other age groups.
Where we live
Having a sense of belonging to a neighbourhood is an important factor not only to personal well-being but also to community well-being and cohesion. Older people seem more likely to report having a sense of neighbourhood belonging when compared to younger people.
In 2014 to 2015, nearly 7 in 10 people aged 16 and over (68.8%) agreed or agreed strongly that they felt they belonged to their neighbourhood. People aged 75 and over reported this sense of belonging most frequently (83.1%). This was higher than all other age groups (apart from those aged 65 to 74). Conversely, younger people aged 16 to 34 were least likely to express this sense of belonging to their neighbourhood (56.6%).
Personal finance
Personal finances are a key ingredient in sustaining our quality of life, with financial security being important to individuals, families and to society generally. In the period 2015 to 2016, 45.6% of those aged 16 and over reported that they were mostly or completely satisfied with their household income. Those aged 16 to 24 were significantly more likely to say that they were mostly or completely satisfied with their household income (47.1%) than those aged 25 to 54. This probably reflects the fact that 16- to 24-year-olds are usually still living in the parental home, so continue to benefit from the household income of their parents. Families and Households: 2017 reported that 6.6 million (40%) 15-to 34-year-olds in the UK lived with their parents. The proportion of those aged 25 to 34 who reported that they were mostly or completely satisfied with their household income was lower than all other age groups (34.0%). Older people aged 75 and over were more likely than all other age groups (except those aged 65 to 74) to be satisfied with their household income (58.3%).
During the same period, 5.9% of people aged 16 and over reported that they were finding it quite or very difficult to get by financially. A higher proportion of young people aged 16 to 24 reported that they were finding it quite or very difficult to get by financially (5.8%) than older people aged 65 to 74 (3.1%) and 75 and over (1.4%). However, this was a lower proportion than those aged 35 to 44 (7.8%) and 45 to 54 (8.4%). The proportion of those aged 75 and over reported that they were finding it quite or very difficult to get by financially was lower than any other age-group. However, this data covers the reference period 2015 to 2016 while the latest Economic well-being release based on data for the 12 months to December 2017 found that respondents reported a worsening in their own financial situation over the last year.
Back to table of contents5. What could explain the differences between age-groups among the measures of national well-being?
This article has highlighted how people in the UK are faring in a range of areas that matter to their quality of life and the main differences between age groups, reflecting both the circumstances of their lives and their own perspectives.
Overall, looking at how life is going now for people of different ages in the UK has highlighted that, contrary to a commonly held belief that ageing involves loss and increasing burden, those aged 65 and over are currently faring better on many measures of personal, social and financial well-being than their younger counter-parts. Despite this, it is important to remember that people aged 65 and over represent a diverse group, with those over 75 particularly noting less satisfaction with health and personal well-being declining as people move into their 80s.
Among younger adults (broadly from 16 to 24), we have highlighted a range of ways in which their experiences of life in the UK today appear to be more challenging. Although they are more likely to be physically active and be more satisfied with their general health than older people, they are also more likely to report symptoms of mental ill health, and less likely to feel they have someone to rely on or a sense of belonging in their neighbourhood. They also have higher rates of unemployment and more frequently report loneliness. This matters both at an individual level and for society as a whole in terms of how well we will be able to sustain high levels of national well-being into the future.
Those in their early and middle years are generally more likely to be in employment but face several challenges that may be linked to more demands placed on their time and the more difficult balance between work and family commitments. In particular, those people aged 25 to 54 are less likely to be satisfied with their leisure time.
These findings represent the latest snapshot of life in the UK using many of the measures of national well-being but we have not explored trends over time for each measure across age groups. Differences between age groups may therefore relate to:
cohort effects – where people born in different eras have different experiences and expectations
the life course perspective – where moving through our lives we change the way we feel due to experiences
socio-economic factors – such as differences in educational attainment, occupations and income between different age groups
It is also important to remember that age is just one of many factors that may contribute to differences in quality of life and not all the observed differences may be primarily due to age.
Back to table of contents6. References
David G. Blanchflower, Andrew J. Oswald, (2008) ‘Is well-being U-shaped over the life cycle?’
Holt-Lunstad, (2015) ‘Loneliness and Social Isolation as Risk Factors for Mortality’
What Works Centre for Wellbeing, (2017) ‘Unemployment, (re)employment and well-being
John T. Haworth, (2010) ‘Life, Work, Leisure, and Enjoyment: the role of social institutions.
Diaz-Serrano and Cabral Vieira, (2005) ‘Low Pay, Higher Pay and Job Satisfaction within the European Union’
Back to table of contents