1. Abstract
This article presents updated estimates of quality adjusted labour input (QALI) for the whole economy and for the market sector. QALI is an input into measuring multi-factor productivity (MFP), which accounts for changes in the composition (or “quality”) of the employed workforce as well as changes in hours worked. The market sector estimates of QALI will be incorporated into MFP estimates in a future publication. Compared with previous QALI releases we have expanded the level of industry granularity and we now use information from the Annual Survey of Hours and Earnings (ASHE) as well as from the Labour Force Survey (LFS).
QALI estimates for 2016 show an improvement in the labour composition or “quality” of the workforce in both the whole economy and the market sector compared with 2015. At the whole economy level, labour quality grew at the fastest rate since 2012, and more than offsetting slower growth of hours worked such that the overall growth of quality adjusted labour was 2.1% in 2016, compared with 1.6% in 2015.
As always we welcome feedback from users, which can be sent via email to productivity@ons.gov.uk.
Back to table of contents2. Introduction
About this release
This article is the latest in a series presenting experimental estimates of labour input used in production. Quality adjusted labour input (QALI) differs from traditional measures of hours worked as it weights the hours worked by different types of workers by their relative contribution to economic production. As a result, a QALI index will be more sensitive to changes in the hours worked of relatively high productivity workers compared with relatively low productivity workers.
We calculate QALI by categorising workers by identifiable characteristics (based on age, sex, industry of employment and level of education), and weighting changes in the hours worked of each worker type by their share of total labour income. The rationale for this approach is that, under competitive markets, economic theory suggests that different factors of production (different categories of workers, and different types of capital assets) will be remunerated according to their marginal productivity. Consequently, relative shares of labour income provide a proxy for the relative productivity or ”quality” of different types of workers.
Using a suitable weighting system, it is possible to subtract movements in hours (sometimes referred to as “unadjusted hours”) from movements in QALI indices, and hence to identify the pure “quality” or compositional movement in labour input to production.
From the perspective of measuring productivity, it is the movement in QALI rather than the movement in hours worked that offers a better representation of what is happening to labour input. For example, growth in labour quality of 1% with hours unchanged is equivalent (abstracting from distributional effects) to growth in hours worked of 1%, with labour quality unchanged.
Layout of the article
The rest of this article is structured as follows. Section 3 describes what is new in this edition, summarising the main changes to sources and to the methodology. Section 4 then presents summary statistics illustrating the main features of the QALI system at the whole economy level. Section 5 outlines the latest QALI estimates for the whole economy and section 6 explores the differences between the market sector and whole economy estimates. Section 7 reviews revisions to the whole economy QALI estimates from the previous QALI publication in October 2016 and revisions to the market sector QALI estimates from the latest multi-factor productivity (MFP) publication in April 2017. Finally section 8 discusses next steps.
Detailed estimates are available in downloadable datasets accompanying this article.
Back to table of contents3. What’s new?
There are two main innovations in this edition. First, we have expanded the industry granularity from 10 to 19 industries. We now separately identify each letter-level industry from the Standard Industrial Classification 2007 (SIC 2007) with the exception of industries S, T and U, which we have combined as “other services”. Descriptions for each industry are shown in Table 2. With six education strata, three age groups and two sexes, this means an increase in the number of categories of hours worked from 360 to 684 (19 multiplied by 6 multiplied by 3 multiplied by 2). The finer industry granularity has been implemented both at the whole economy level and in a parallel market sector version, which filters out hours worked in non-market activities.
Quality adjusted labour input (QALI) income weights require estimates of average hourly levels of remuneration for each category (or at least for all those with non-zero estimates of hours worked). Previous QALI releases have relied exclusively on the Labour Force Survey (LFS) in compiling these estimates. But to provide more quality assurance, our second innovation is to utilise earnings information from the Annual Survey of Hours and Earnings (ASHE) as well as from LFS.
We published an article on the proposed methodology for using ASHE in July 2017. That article demonstrated proof of concept but did not include any results. We have made good progress since July in terms of refining the proposed methodology and the results in this release are the first to benefit from adjusting category-level earnings estimates from LFS to a set of benchmarks derived from ASHE. This innovation has also been implemented for the market sector version of QALI. This uses a second set of ASHE earnings estimates, with the ASHE sample trimmed as closely as possible to the specification of the market sector LFS sample1.
As noted in the July 2017 article, utilising ASHE requires some estimation to take account of the different measure of hours worked in ASHE to that used in LFS (ASHE records paid hours whereas we use actual hours in LFS), and to impute earnings values for categories where LFS estimates are missing (although these categories typically account for only very small proportions of hours worked). At this stage the estimation routines are common between the whole economy and market sector versions of QALI. We plan to investigate the use of separate estimation routines for each version, although we would not expect this to materially affect our results.
We continue to benchmark industry level hours worked and labour remuneration to control totals taken from our labour productivity system and national accounts respectively, although these controls are now implemented at a finer level of granularity. This implies that ASHE estimates only impact on QALI through the distribution of earnings within each industry (that is, in terms of education, age and sex). In practice, however, we also use ASHE to inform the derivation of industry level control totals for labour remuneration in those cases where national accounts estimates are not available at the required level of granularity. This is particularly applicable to the market sector version of QALI, since the national accounts do not provide income breakdowns for this concept.
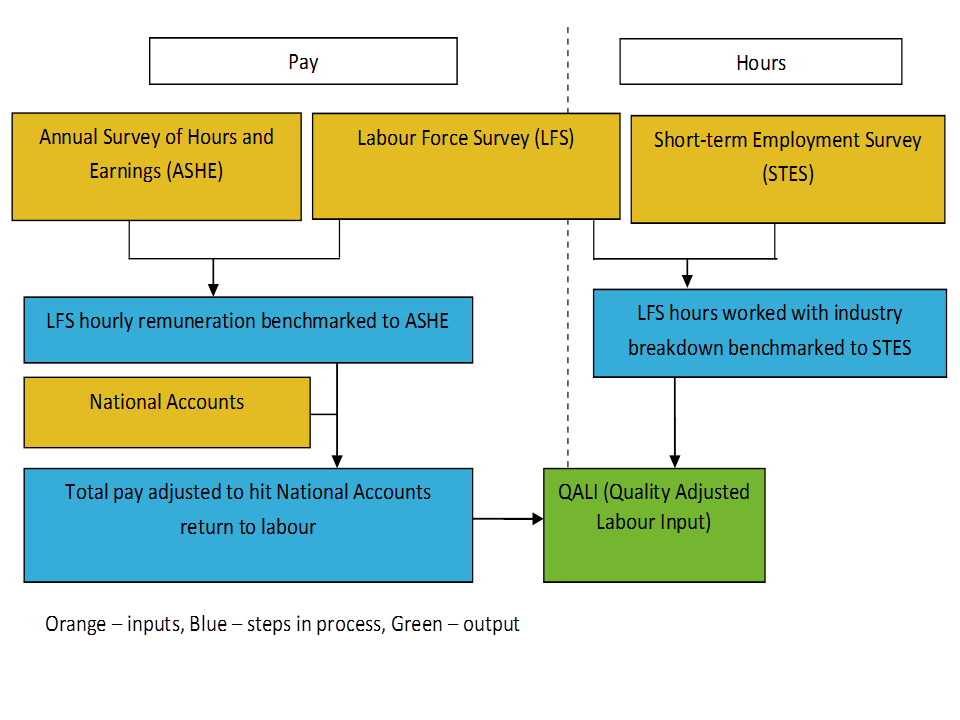
A simplified QALI process map is shown in Figure 1. Labour productivity estimates of hours worked in each industry are based on employee jobs estimates derived from our Short-Term Employment Surveys (STES), combined with average hours estimates taken from the LFS. LFS is also the source for estimates of hours worked by the self-employed. The income side of the national accounts provides an industry breakdown of labour remuneration, using the methodology described in Productivity measures, sectional unit labour costs, published in 2012. Labour remuneration is a wider concept than pay or earnings and is made up of compensation of employees and a proportion of mixed income representing the return to labour from self-employment.
ASHE includes a variable with employer pension contributions from 2005 onwards and this is included when calculating bottom level hourly remuneration. The benefit is that this should improve the estimation of income weights within industries (that is, by age, sex and education), given that income weights should reflect the total labour costs.
Figure 1: Simplified QALI process map
Source: Office for National Statistics
Download this image Figure 1: Simplified QALI process map
.png (25.3 kB)
This edition incorporates annual population survey revisions to LFS estimates back to Quarter 3 (July to Sept) 2012 and industry-level income constraints from Blue Book 2017. The latter, together with methodological changes described previously, generate revisions throughout the QALI time series.
The detailed methodology otherwise used within QALI has not changed in this publication and it can be found in full in Quality-adjusted labour input: estimates to 2010, published on 30 May 2012.
Notes for: What’s new?
- Trimming for the market sector uses variables in ASHE and LFS on industry of employment and the form of organisation worked for. Trimming of LFS applies to employees only; all self-employment is assumed to take place in the market sector.
4. Some descriptive statistics
A quality adjusted labour input (QALI) index is compiled from component level estimates of hours worked and shares in labour remuneration. Table 1 provides a stylised illustration to show how a QALI index can differ from a simple volume measure of hours worked, using a simple two-component QALI model in which hours worked and labour remuneration are divided into just two categories.
Table 1: Stylised example of a quality adjusted labour input (QALI) index
| Period 1 | Period 2 | |||||||||
|---|---|---|---|---|---|---|---|---|---|---|
| Hours worked | Hours worked | Hourly pay (£/hr) | Pay share | Log change in hours | Change in "QALI" | Change in composition | ||||
| Scenario 1 | ||||||||||
| Category A | 180 | * | 220 | * | 10 | * | 20% | 20.1% | 4.0% | |
| Category B | 820 | * | 780 | * | 10 | * | 80% | -5.0% | -4.0% | |
| TOTAL | 1000 | 1000 | 0.0% | 0.0% | 0.0% | |||||
| Scenario 2 | ||||||||||
| Category A ('high wage') | 190 | * | 209 | * | 25 | * | 50% | 9.5% | 4.8% | |
| Category B ('low wage') | 810 | * | 891 | * | 6 | * | 50% | 9.5% | 4.8% | |
| TOTAL | 1000 | 1100 | 9.5% | 9.5% | 0.0% | |||||
| Scenario 3 | ||||||||||
| Category A ('high wage') | 180 | * | 220 | * | 25 | * | 50% | 20.1% | 10.0% | |
| Category B ('low wage') | 820 | * | 780 | * | 6 | * | 50% | -5.0% | -2.5% | |
| TOTAL | 1000 | 1000 | 0.0% | 7.5% | 7.5% | |||||
| Source: Office for National Statistics | ||||||||||
| Notes: | ||||||||||
| 1. * = Figures are exogenous, other figures are derived in the table | ||||||||||
Download this table Table 1: Stylised example of a quality adjusted labour input (QALI) index
.xls (33.8 kB)Two conditions are needed for a QALI index to differ from a simple volume measure of hours worked, namely differences in hourly earnings between component categories and differences in movements in hours worked.
In an extreme egalitarian society, where Premier League footballers earned the same hourly rate as fruit pickers, a QALI index would always exactly track a simple volume measure of hours worked, even when hours worked of the different categories were evolving differently. This is illustrated in the top panel of Table 1 (Scenario 1), where hourly pay (an approximate measure of remuneration) is the same for both categories of workers.
Equally, if hourly pay rates vary across categories but hours worked evolve in exactly the same way across all categories, then again a QALI index will mirror a simple volume index of hours worked, as illustrated in the middle panel of Table 1 (Scenario 2). In each case the “QALI” index is constructed by summing across categories, with each component calculated as the product of the (log) change in hours worked and the pay share, where the pay share is averaged over the two time periods.
In the bottom panel of Table 1 (Scenario 3) hourly pay and the growth of hours both differ between the two categories. In this example, a QALI index rises by 7.5% between the two time periods compared with no change for a simple measure of hours worked. This reflects a compositional improvement, as the share of hours worked by the “high wage” category is increasing and that of the “low wage” category is decreasing.
Table 2 shows that both conditions required for compositional effects to materialise are met in the actual UK labour market data. The first two columns of figures in Table 2 show relative hourly remuneration in 2007 (the last year before the economic downturn) and 2016, summarised over different QALI sub-aggregates and expressed relative to estimated average hourly remuneration of the UK total employed workforce in each year. These data show that hourly remuneration is not uniform across QALI categories and also that relative remuneration has changed over time, reflecting movements in supply and demand for different categories of labour. The two columns of figures on the right of Table 2 show shares of hours worked in the same years.
Table 2: Relative hourly remuneration and shares of hours worked by quality adjusted labour input (QALI) category
| 2007 and 2016, UK, Whole economy | ||||
| Hourly remuneration | Shares of hours worked | |||
|---|---|---|---|---|
| Whole economy = 100 | % | |||
| 2007 | 2016 | 2007 | 2016 | |
| Industry | ||||
| Agriculture, Forestry and Fishing (A) | 51 | 44 | 1.6 | 1.5 |
| Mining and Quarrying (B) | 229 | 254 | 0.3 | 0.2 |
| Manufacturing (C) | 114 | 126 | 10.9 | 9.0 |
| Electricity, Gas, Steam and Air Conditioning Supply (D) | 171 | 164 | 0.4 | 0.5 |
| Water Supply; Sewerage, Waste Management and Remediation Activities (E) | 150 | 123 | 0.5 | 0.6 |
| Construction (F) | 82 | 86 | 8.6 | 7.8 |
| Wholesale and Retail Trade; Repair of Motor Vehicles and Motorcycles (G) | 80 | 86 | 14.8 | 14.3 |
| Transportation and Storage (H) | 104 | 106 | 5.3 | 5.2 |
| Accommodation and Food Service Activities (I) | 59 | 59 | 5.5 | 5.7 |
| Information and Communication (J) | 143 | 135 | 4.5 | 4.8 |
| Financial and Insurance Activities (K) | 198 | 181 | 4.0 | 3.6 |
| Real Estate Activities (L) | 83 | 83 | 1.4 | 1.6 |
| Professional, Scientific and Technical Activities (M) | 106 | 84 | 7.7 | 8.8 |
| Administrative and Support Service Activities (N) | 64 | 80 | 7.5 | 8.4 |
| Public Administration and Defence; Compulsory Social Security (O) | 114 | 131 | 5.9 | 4.5 |
| Education (P) | 140 | 123 | 6.4 | 7.1 |
| Human Health and Social Work Activities (Q) | 90 | 90 | 10.0 | 11.3 |
| Arts, Entertainment and Recreation (R) | 54 | 65 | 2.2 | 2.2 |
| Other Services (STU) | 104 | 118 | 2.5 | 2.6 |
| Sex | ||||
| Females | 88 | 91 | 39.2 | 39.5 |
| Males | 107 | 106 | 60.8 | 60.5 |
| Age | ||||
| 16-29 years | 70 | 71 | 25.0 | 23.5 |
| 30-49 years | 113 | 110 | 50.2 | 47.2 |
| 50+ | 105 | 108 | 24.8 | 29.3 |
| Education | ||||
| No qualifications | 66 | 65 | 8.5 | 5.2 |
| GCSEs or equivalent | 80 | 79 | 33.8 | 28.4 |
| A – levels or trade apprenticeships | 92 | 87 | 23.7 | 22.6 |
| Certificates of education or equivalent | 110 | 103 | 9.5 | 9.4 |
| First and other degrees | 134 | 121 | 17.0 | 22.6 |
| Masters and doctorates | 162 | 146 | 7.4 | 11.8 |
| Source: Office for National Statistics | ||||
Download this table Table 2: Relative hourly remuneration and shares of hours worked by quality adjusted labour input (QALI) category
.xls (35.8 kB)Table 2 offers some evidence that remuneration differentials have narrowed over time. The differentials for relatively high reward industries such as K (financial and insurance activities) and J (information and communication) were lower in 2016 than in 2007 (although relative remuneration in industry K had increased very sharply in the years leading up to 2007). Relative hourly remuneration in some low-pay industries such as G (wholesale and retail trade), N (administrative and support services) and R (arts, entertainment and recreation) has increased, perhaps reflecting the impact of increases in the National Minimum Wage and National Living Wage.
But on the other hand, hourly remuneration in industry I (accommodation and food service activities) remains at around three-fifths of the UK average, and hourly remuneration in some high-pay industries such as C (manufacturing) and O (public administration and defence) has increased relative to the UK average over this period.
Unpacking industries A (agriculture, forestry and fishing), B (mining and quarrying), D (electricity, gas, steam and air conditioning) and E (water supply, sewerage, waste treatment and remediation), which have been combined into a single industry group in previous QALI releases, reveals sharp divergences, including the least remunerated industry (A) and the best remunerated (B). The dataset published alongside this release also reveals substantial year-to-year variation in these industries.
Table 2 shows only limited movement in relative remuneration by age and sex, reflecting the broad aggregation of these categories. The gender remuneration differential in favour of males was only marginally lower in 2016 than in 2007 (and a longer time series shows similar consistency). Older workers have closed the remuneration gap compared with workers aged 30 to 49, while the youngest age cohort has experienced a slight increase in their relative remuneration.
As in previous releases, the QALI dataset shows a strong link between levels of education and relative hourly remuneration, although this has tended to diminish over time, possibly reflecting large increases in the proportion of the population entering tertiary education. The premium earned by the highest education cohort (masters and doctorates) was lower in 2016 than in 2007 but remains substantial. The premiums for workers with first and other degrees, with certificates of education or their equivalents and with A-levels were the lowest on record compared to the average in 2016.
The dataset published alongside this release contains equivalent estimates for the market sector, that is, filtering out workers in non-market activities such as public administration, education and health services, as well as workers in the non-profit institutions such as charities. These data show a similar pattern across industries except that remuneration of market sector workers in P and Q (human health and social work activities) is lower than in Table 2, implying that the non-market cohort is relatively well-remunerated. There is some evidence that the gender pay gap is wider in the market sector, and similarly largely unchanged through time. The pattern of remuneration across education categories is similar in the market sector sample to that shown for the whole economy in Table 2.
The right-hand columns of Table 2 report shares of hours worked. One point of interest is that the shares across industries vary substantially. Industries G and Q (human health and social work activities) together account for around one-quarter of all hours worked in the economy, while at the other extreme, industries B, D and E together account for only a little over 1% of hours worked. Although the level of hours worked in manufacturing (C) has been broadly flat since the economic downturn (in sharp contrast to the trend decline over the post-war period), manufacturing has still experienced the largest decline in share terms since 2007, followed by industry O. The largest increases in shares of hours worked have been in industries Q, M (professional, scientific and technical activities) and N.
The share of hours worked by sex shows a small shift towards females between 2007 and 2016. An interesting impact of the finer industry granularity in this release compared with previous editions of QALI is that it has caused a level shift towards females of around half a percentage point. This likely reflects the separate identification of industries P (education) and Q with high levels of female participation. For example, females account for around two-thirds of hours worked in P, and around three-quarters of hours worked in Q.
Table 2 also shows a distinct shift in age composition. The share of labour input accounted for by the oldest age cohort is the highest on record in 2016, likely reflecting growing labour market participation among this group – possibly reflecting changes to retirement ages and the growing prevalence of self-employment in particular among these workers. There has also been a pronounced shift in the distribution of hours worked by level of education, particularly among the highest and lowest qualified. The share of hours worked of the highest two education categories increased by almost 10 percentage points between 2007 and 2016, mirroring a similar fall in the shares of the lowest two education categories.
Back to table of contents5. Results: whole economy
Figure 2 shows the annual changes in whole economy quality adjusted labour input (QALI) and the contributions of hours worked and labour quality for 1995 to 2016. Labour quality contributed 0.8 percentage points to the growth of quality adjusted labour in 2016, following two years of negligible movements in labour quality. This was the fastest growth in labour quality since 2012. By contrast, growth of hours worked in 2016 was the lowest since 2011, although, at 1.4 percentage points, it was still strong by historical standards.
Figure 2: Annual quality adjusted labour input (QALI) growth, whole economy
UK, 1995 to 2016
Source: Office for National Statistics
Download this chart Figure 2: Annual quality adjusted labour input (QALI) growth, whole economy
Image .csv .xlsThis is reinforced in Figure 3, which shows quarterly trajectories of QALI and hours worked indexed to Quarter 1 (Jan to Mar) 2008 equals 100, and labour quality as the differences between the two indices on the right-hand axis.
While hours worked have increased on a more or less continuous trajectory since 2011, the time series for labour quality is more nuanced. Labour quality increased strongly during and immediately after the economic downturn (recall that labour quality can increase by low productivity workers leaving the labour force, as well as by high productivity workers joining the labour force). But labour quality in Quarter 3 (July to Sept) 2015 was little different from three years earlier, and after rising strongly in Quarter 4 (Oct to Dec) 2015 and Quarter 1 (Jan to Mar) 2016, labour quality has drifted downwards over the subsequent four quarters.
Figure 3: Quarterly quality adjusted labour input (QALI), whole economy
UK, quarter 1 (Jan to Mar) 2008 to quarter 1 2017

Source: Office for National Statistics
Download this image Figure 3: Quarterly quality adjusted labour input (QALI), whole economy
.png (49.1 kB) .xls (33.8 kB)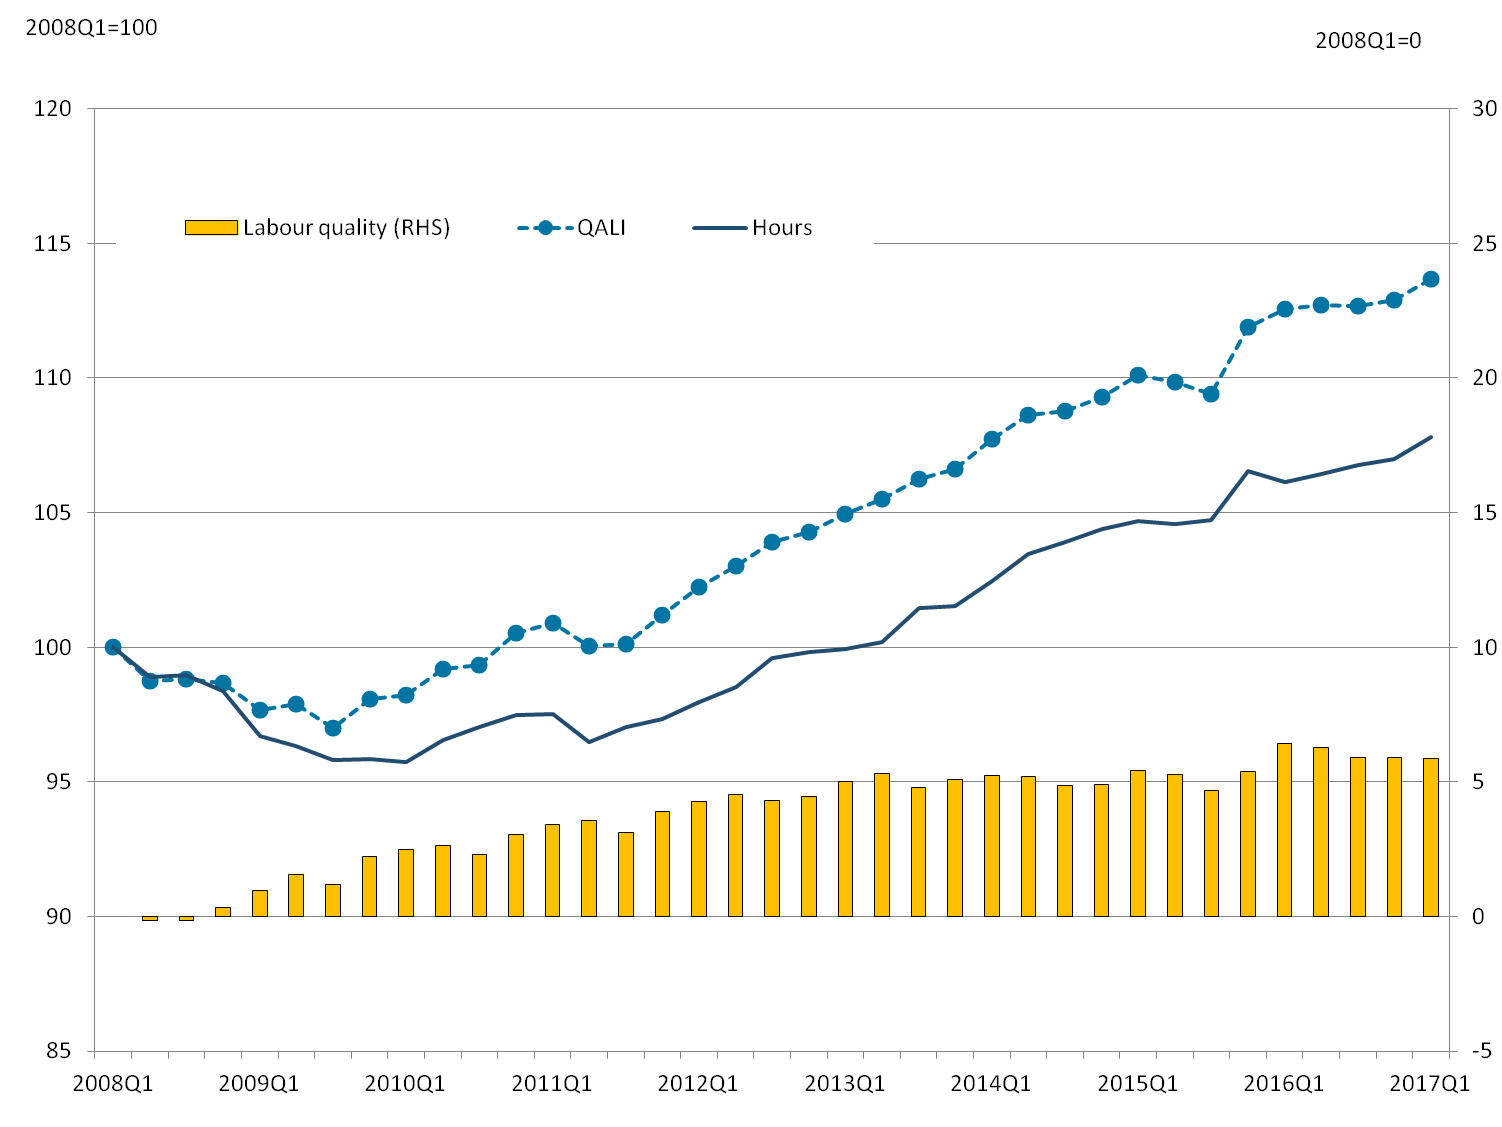
Figure 4 shows annual QALI growth and its contributions for the whole economy by industry. There is a high degree of variability by industry but there are some important features. First, it is perhaps not surprising that the largest movements were in industries with the smallest shares of hours worked, notably industry B, but also industries A (agriculture, forestry and fishing), D (electricity, gas, steam and air conditioning) and E (water supply, sewerage, waste management and remediation activities). Small labour shares imply small sample sizes in the Labour Force Survey (LFS) data, leading to corresponding volatility in the QALI estimates.
Among the larger industries, QALI movements tended to be dominated by movements in hours worked in 2016, although there were sizeable contributions from labour quality in a number of industries including K (financial and insurance activities), Q (human health and social work activities) and STU (other services).
Figure 4: Quality adjusted labour input (QALI) growth by industry, whole economy breakdown
UK, 2016
Source: Office for National Statistics
Notes:
- A refers to agriculture, forestry and fishing. B refers to mining and quarrying. C refers to manufacturing. D refers to electricity, gas, steam and air conditioning supply. E refers to water supply; sewerage, waste management and remediation activities. F refers to construction. G refers to wholesale and retail trade. H refers to transportation and storage. I refers to accommodation and food services. J refers to information and communication. K refers to financial and insurance activities. L refers to real estate activities. M refers to professional and scientific activities. N refers to administrative and support activities. O refers to public administration and defence. P refers to education. Q refers to health and social work. R refers to arts and entertainment. STU refers to other services.
Download this chart Figure 4: Quality adjusted labour input (QALI) growth by industry, whole economy breakdown
Image .csv .xlsFigure 5 shows average annual QALI growth by industry between 2008 and 2016, that is, since the economic downturn. In contrast to the single year estimates for 2016 (Figure 4), labour quality has made discernible positive contributions to QALI growth across all industries over this period, apart from mining and quarrying. For several industries, including G (wholesale and retail trade), K (financial and insurance activities) and R (arts, entertainment and recreation), the average annual contribution from labour quality exceeds the contribution from hours worked, and in other industries the respective contributions are broadly similar in magnitude.
Growth of hours worked is considerably more variable across industries than the contributions from labour quality. Hours worked have fallen by 2% a year on average in industry O (public administration and defence), but risen by close to 4% a year in industry D (electricity, gas, steam and air conditioning).
Figure 5: Quality adjusted labour input (QALI) average growth by industry, whole economy breakdown
UK, 2008 to 2016 averages
Source: Office for National Statistics
Notes:
- A refers to agriculture, forestry and fishing. B refers to mining and quarrying. C refers to manufacturing. D refers to electricity, gas, steam and air conditioning supply. E refers to water supply; sewerage, waste management and remediation activities. F refers to construction. G refers to wholesale and retail trade. H refers to transportation and storage. I refers to accommodation and food services. J refers to information and communication. K refers to financial and insurance activities. L refers to real estate activities. M refers to professional and scientific activities. N refers to administrative and support activities. O refers to public administration and defence. P refers to education. Q refers to health and social work. R refers to arts and entertainment. STU refers to other services.
Download this chart Figure 5: Quality adjusted labour input (QALI) average growth by industry, whole economy breakdown
Image .csv .xlsAs noted previously, there has been a substantial increase in the share of hours worked by people with higher qualifications over recent years. This trend continued in 2016, with strong growth in hours worked by those in the highest education category (masters and doctorates) as shown in Figure 6. The QALI index for this group grew by over 13% in 2016, following growth of 14% in 2015, with a small negative contribution for labour quality.
By contrast, QALI and hours worked fell for each of the three lowest education categories in 2016. There is typically not much variation in labour quality contributions when aggregated by age and sex. Intuitively this is because these are large sub-samples of the working population, with fairly stable distributions across the remaining QALI categories.
Figure 6: Quality adjusted labour input (QALI) growth by education, age and sex, whole economy breakdown
UK, 2016
Source: Office for National Statistics
Notes:
- Key to education groups: 1 refers to no qualifications. 2 refers to GCSEs or equivalent. 3 refers to A-levels or trade apprenticeships. 4 refers to certificates of education or equivalent. 5 refers to first and other degrees. 6 refers to masters and doctorates.
Download this chart Figure 6: Quality adjusted labour input (QALI) growth by education, age and sex, whole economy breakdown
Image .csv .xlsMovements in labour quality in Figure 6 reflect compositional shifts conditional on the category on the x-axis, for example, a shift in the share of workers in a particular education group across industries. In light of the pronounced shift in hours worked towards workers in higher education groups it is perhaps surprising that there is not more evidence of offsetting movements in labour quality. This suggests that the UK labour market was able to absorb this shift in hours worked without materially reducing the average earnings premia on education.
Figure 7 shows equivalent growth rates and contributions to QALI in annual average terms over the period 2008 to 2016. This underlines the shift in the composition of the workforce away from less-educated workers and towards higher-educated workers. Combined with the pattern of hourly remuneration shown in Table 2, this is the main driver of improvements in labour quality at the aggregate level and across industries, age classes and sex.
Figure 7 also shows notable differences across the QALI age categories, again largely reflecting different rates of growth of hours worked. There is also some evidence that labour quality of females has grown a little faster than that of males over this period.
Figure 7: Quality adjusted labour input (QALI) average growth by education, age, sex, whole economy breakdown
UK, 2008 to 2016 annual averages
Source: Office for National Statistics
Notes:
- Key to education groups: 1 refers to no qualifications. 2 refers to GCSEs or equivalent. 3 refers to A-levels or trade apprenticeships. 4 refers to certificates of education or equivalent. 5 refers to first and other degrees. 6 refers to masters and doctorates.
Download this chart Figure 7: Quality adjusted labour input (QALI) average growth by education, age, sex, whole economy breakdown
Image .csv .xls6. Comparing whole economy and market sector estimates
Introduction
As mentioned in Section 3, we have developed a corresponding quality adjusted labour input (QALI) framework for the market sector with expanded industry coverage1 and functionality to accommodate earnings information from both the Labour Force Survey (LFS) and the Annual Survey of Hours and Earnings (ASHE). We published further information on the market sector methodology in October 2016 and July 2017.
The motivation behind development of the market sector version of QALI is as an input to our measures of multi-factor productivity (MFP). Indeed, it is with the aim of expanding the industry granularity of our MFP estimates that has motivated our expansion of industry granularity in QALI. MFP provides an analytical framework for decomposing changes in economic output into components due to changes in inputs of capital and labour. This framework fits reasonably well with the measurement conventions for outputs and inputs in the market sector, but sits less comfortably with measurement conventions in the non-market sector, where for example, output prices do not exist and the contribution of capital to output is under-recorded relative to capital in the market sector.
This raises a question as to the motivation for the whole economy version of QALI, and more generally whether our “headline” QALI results should be those pertaining to the whole economy or to the market sector. We welcome user feedback on these questions. For now we have chosen to lead on the whole economy results and provide some comparisons between results for the whole economy and the market sector. The datasets published alongside this release include the same amount of supplementary information for each version.
Users are reminded that “market sector” is not exactly the same as “private sector” (and equivalently, the non-market sector is not identical to the “public sector”). This is perhaps best illustrated by industry L (real estate activities) where the market sector output measure removes the “imputed rentals” component, accounting for around 72% of current price output of industry L (and almost one-tenth of whole economy output). “Imputed rentals” is classified as a non-market activity but has nothing to do with the public sector. In national accounts terms it is an activity that is both produced and consumed by owner-occupier households, with zero recorded labour input.
Comparisons
Figure 8 shows annual QALI growth, expressed as differences between the aggregate whole economy estimates (as in Figure 2) and the equivalent estimates for the aggregate market sector using the corresponding market sector framework. Points above (below) the horizontal axis therefore indicate that the quality of labour index grew more quickly (slowly) in the whole economy than in the market sector. For example, the overall QALI index for the market sector grew by 2.0% in 2016, which is 0.1 percentage points lower than the growth of the whole economy index. This small difference is entirely accounted for by slower growth of labour quality in the market sector.
Figure 8 suggests that differences in growth rates are generally less than around 1.0 percentage point – only exceeding this threshold by a clear margin in 2009 – and are dominated by differences in growth of hours worked. The relatively large difference in 2009 reflects market sector hours falling more sharply during the economic downturn than in the economy as a whole.
Figure 8: Difference in annual quality adjusted labour input (QALI) growth
Whole economy minus market sector, UK, 1995 to 2016
Source: Office of National Statistics
Notes:
- Differences between whole economy (WE) and market sector (MS) estimates, (WE minus MS).
Download this chart Figure 8: Difference in annual quality adjusted labour input (QALI) growth
Image .csv .xlsFigure 9 focuses in on quarterly differences during and after the economic downturn. This shows differences in indices of QALI and hours worked (indexed to Quarter 1 2008), with differences in labour quality shown in the vertical bars. The interpretation is as follows. Starting from Quarter 1 2008 equals 100, a QALI index for the whole economy was around 0.7 points lower in Quarter 1 2017 than a QALI index for the market sector. This difference was made up of a 1.2 point difference in hours worked (whole economy lower than market sector), partly offset by a 0.5 point difference in labour quality (whole economy higher than market sector).
Figure 9 highlights the initial outperformance of hours worked across the whole economy metrics during the economic downturn (that is, hours fell faster in the market sector than in the economy as a whole). Since 2011 however, market sector hours have grown faster, albeit with some evidence of tailing off since the middle of 2015. Labour quality has generally been at least as positive at the whole economy level as at the market sector level, but without a clear trend.
Figure 9: Differences in quarterly quality adjusted labour input (QALI)
Whole economy minus market sector, UK, Quarter 1 (Jan to Mar (2008) to Quarter 1 2017
Source: Office for National Statistics
Notes:
- Differences between whole economy (WE) and market sector (MS) estimates, (WE minus MS).
Download this chart Figure 9: Differences in quarterly quality adjusted labour input (QALI)
Image .csv .xlsFigure 10 shows differences in QALI results for 2016 between the whole economy and the market sector by industry, expressed as differences in growth rates. Positive differences imply that the whole economy QALI metric grew faster than the equivalent market sector metric in 2016. Industries with zero differences are those where the market sector coverage is identical to the whole economy coverage, that is, where non-market activity is zero2. No differences are shown for industry O (public administration and defence) because the market sector component of this industry is zero (that is, all activity in this industry, which relates to running public services, is non-market).
Unsurprisingly, there are sizeable differences in industries with substantial levels of non-market activity such as P (education) and Q (human health and social work activities), although the differences in other industries including L (real estate activities) and STU (other services) are similar in magnitude. Most of the differences reflect differences in hours worked, with noticeable differences in labour quality in industries E (electricity, gas, steam and air conditioning) and R (arts, entertainment and recreation).
Figure 10: Differences in quality adjusted labour input (QALI) growth by industry
Whole economy minus market sector, UK, 2016
Source: Office for National Statistics
Notes:
- A refers to agriculture, forestry and fishing. B refers to mining and quarrying. C refers to manufacturing. D refers to electricity, gas, steam and air conditioning supply. E refers to water supply; sewerage, waste management and remediation activities. F refers to construction. G refers to wholesale and retail trade. H refers to transportation and storage. I refers to accommodation and food services. J refers to information and communication. K refers to financial and insurance activities. L refers to real estate activities. M refers to professional and scientific activities. N refers to administrative and support activities. O refers to public administration and defence. P refers to education. Q refers to health and social work. R refers to arts and entertainment. STU refers to other services.
- Non-market activity is found in industries E, H, J, L, M, N, O (100%), P, Q, R and STU.
- Differences between whole economy (WE) and market sector (MS) estimates, (WE minus MS).
Download this chart Figure 10: Differences in quality adjusted labour input (QALI) growth by industry
Image .csv .xlsFigure 11 shows differences in average annual growth rates over the period 2008 to 2016. It is clear that there has been faster growth of hours worked and to a lesser extent of labour quality in the market sector segments of industries E, P and Q, and faster growth of labour quality in STU. But improvements in labour quality in the market sector have trailed behind improvements in the whole economy in industries L and R.
Figure 11: Differences in average annual quality adjusted labour input (QALI) growth by industry
Whole economy minus market sector, UK, 2008 to 2016
Source: Office for National Statistics
Notes:
- A refers to agriculture, forestry and fishing. B refers to mining and quarrying. C refers to manufacturing. D refers to electricity, gas, steam and air conditioning supply. E refers to water supply; sewerage, waste management and remediation activities. F refers to construction. G refers to wholesale and retail trade. H refers to transportation and storage. I refers to accommodation and food services. J refers to information and communication. K refers to financial and insurance activities. L refers to real estate activities. M refers to professional and scientific activities. N refers to administrative and support activities. O refers to public administration and defence. P refers to education. Q refers to health and social work. R refers to arts and entertainment. STU refers to other services.
- Non-market activity is found in industries E, H, J, L, M, N, O (100%), P, Q, R and STU.
- Differences between whole economy (WE) and market sector (MS) estimates, (WE minus MS).
Download this chart Figure 11: Differences in average annual quality adjusted labour input (QALI) growth by industry
Image .csv .xlsAlongside these differences between the market sector and whole economy QALI results by industry, there are differences for several groupings of workers. Figure 12 shows the difference in QALI growth in 2016 between the whole economy and market sector frameworks for other QALI categories. This suggests that the compositional shift in the labour force towards higher-educated workers was a little more pronounced in the market sector in 2016, and there was a marked difference in terms of sex.
Figure 12: Differences in quality adjusted labour input (QALI) growth, by education, age and sex
Whole economy minus market sector, UK, 2016
Source: Office for National Statistics
Notes:
1.Key to education groups: 1 refers to no qualifications. 2 refers to GCSEs or equivalent. 3 refers to A-levels or trade apprenticeships. 4 refers to certificates of education or equivalent. 5 refers to first and other degrees. 6 refers to masters and doctorates. 2. Differences between whole economy (WE) and market sector (MS) estimates, (WE minus MS).
Download this chart Figure 12: Differences in quality adjusted labour input (QALI) growth, by education, age and sex
Image .csv .xlsDifferences in growth rates are less pronounced when averaged over the period 2008 to 2016 (Figure 13). The extent to which market sector labour input has outpaced that of the whole economy is tilted towards higher education groups (not just the highest), to the middle and older age cohorts, and to females. However, deployment of the youngest age cohort has grown a little faster in the whole economy than in the market sector over this period.
Figure 13: Differences in average annual quality adjusted labour input (QALI) growth by education, age and sex
Whole economy minus market sector, UK, 2008 to 2016
Source: Office for National Statistics
Notes:
1.Key to education groups: 1 refers to no qualifications. 2 refers to GCSEs or equivalent. 3 refers to A-levels or trade apprenticeships. 4 refers to certificates of education or equivalent. 5 refers to first and other degrees. 6 refers to masters and doctorates. 2. Differences between whole economy (WE) and market sector (MS) estimates, (WE minus MS).
Download this chart Figure 13: Differences in average annual quality adjusted labour input (QALI) growth by education, age and sex
Image .csv .xlsNotes for: Comparing whole economy and market sector estimates
The market sector version of QALI contains the same 19 industries as the whole economy version but industry O (public administration and defence) is empty because there is no market sector activity in this industry within the national accounts. When market sector filters are applied to LFS and ASHE, small numbers of workers are assigned to industry O. Our methodology re-assigns these workers to industry N (professional, scientific and technical activities).
Unrounded estimates for industries that are entirely market sector are not exactly zero. This is due to computational limits on numerical precision in the underlying calculations.
7. Revisions analysis
This section looks at revisions at the whole economy level since the last quality adjusted labour input (QALI) release in October 2016. We also touch on revisions to the market sector results compared with the QALI estimates used in the market sector multi-factor productivity (MFP) release in April 2017.
Revisions since October 2016
Revisions since October 2016 reflect methodological changes to expand the level of industry granularity and incorporate earnings estimates derived from the Annual Survey of Hours and Earnings (ASHE), as well as revisions to Labour Force Survey (LFS) population weights, to employee jobs and to industry level constraints. Updated population weights have only a marginal effect on QALI results. Revisions to employee jobs (which flow partly from revised LFS weights as well as new and revised survey data) affect the distribution of employment across industries but not the overall level.
Income constraints have been revised to align with annual estimates from Office for National Statistics (ONS) supply and use tables, and updated from Blue Book 2014 to Blue Book 2017 vintage. Changes to industry level labour income shares are very small in the whole economy QALI framework. Revisions to income shares are larger in the market sector version, principally resulting from re-classifying around 700,000 university staff and their labour income out of the market sector.
Revisions to the whole economy QALI series are shown in Figure 14 as differences in average annual growth rates since 2008 for the overall QALI index and each of the 10 industry groups in the October 2016 release. Average differences for the overall whole economy series are negligible. There are offsetting revisions to growth of hours worked, mainly reflecting the revisions to employee jobs noted previously. The methods changes introduced in this release deliver a little more quality improvement in the combined ABDE industry group (agriculture, forestry and fishing, mining and quarrying, electricity, gas, steam and air conditioning supply, water supply; sewerage, waste management and remediation activities), in financial services and in LMN (real estate activities, professional and scientific activities, administrative and support activities), but a little less quality improvement in manufacturing and government services.
Figure 14: Revisions to whole economy average annual quality adjusted labour input (QALI) growth by industry
Current minus previous, UK, 2008 to 2015
Source: Office for National Statistics
Notes:
- ABDE refers to agriculture, forestry and fishing, mining and quarrying, electricity, gas, steam and air conditioning supply, water supply; sewerage, waste management and remediation activities. C refers to manufacturing. F refers to construction. GI refers to wholesale and retail trade, accommodation and food services. H refers to transportation and storage. J refers to information and communication. K refers to financial and insurance activities. LMN refers to real estate activities, professional and scientific activities, administrative and support activities. OPQ refers to public administration and defence, education, health and social work. RSTU refers to arts and entertainment, other services.
Download this chart Figure 14: Revisions to whole economy average annual quality adjusted labour input (QALI) growth by industry
Image .csv .xlsRevisions since April 2017
Figure 15 shows QALI results for the market sector in this release compared with the estimates used in our April 2017 MFP release. Revisions are larger than for the whole economy estimates, although the scale of revisions is more comparable with the exception of a large revision to hours worked in the market sector component of P (education), which feeds into the OPQ industry group (public administration and defence, education, health and social work). This reflects the re-classification of university staff out of the market sector, which results in faster measured growth of hours worked in the residual market sector component.
Figure 15: Revisions to market sector average annual quality adjusted labour input (QALI) growth by industry
Current minus previous, UK, 2008 to 2015
Source: Office for National Statistics
Notes:
- ABDE refers to agriculture, forestry and fishing, mining and quarrying, electricity, gas, steam and air conditioning supply, water supply; sewerage, waste management and remediation activities. C refers to manufacturing. F refers to construction. GI refers to wholesale and retail trade, accommodation and food services. H refers to transportation and storage. J refers to information and communication. K refers to financial and insurance activities. LMN refers to real estate activities, professional and scientific activities, administrative and support activities. OPQ refers to public administration and defence, education, health and social work. RSTU refers to arts and entertainment, other services.
Download this chart Figure 15: Revisions to market sector average annual quality adjusted labour input (QALI) growth by industry
Image .csv .xls8. Next steps
We intend to use the industry level market sector quality adjusted labour input (QALI) estimates from this release as an input into an expanded 19-industry multi-factor productivity (MFP) release, currently scheduled for publication in April 2018. The focus of our ongoing QALI development work is twofold.
First, we plan to exploit the additional data quality provided by the Annual Survey of Hours and Earnings (ASHE) to further expand the industry granularity of QALI. We are aiming to compile (annual) QALI estimates for 64 industries, corresponding with the bottom level industry detail available in our Gross Fixed Capital Formation system, which provides the source data for our estimates of capital services. The aim is then to expand our MFP framework to 64 industries.
Second, we plan to investigate the use of the predecessor survey to ASHE (the New Earnings Survey) to compile QALI estimates before 1994.
Back to table of contents