Table of contents
- Main points
- Things you need to know about this release
- Men took more leisure than women in 2015 in the UK
- When not in leisure, women were more likely to be performing unpaid work
- Men spent more time playing sports, practising hobbies, gaming and computing or consuming mass media while women use more time for socialising
- Leisure time was lowest for those aged 25 to 34 years but increased with age
- Leisure time was highest for those in the South East of England and lowest for those in Northern Ireland
- Those in skilled trades took the least leisure time while those in sales and customer service occupations took the most
- Those employed full-time took the least leisure time but enjoyed it most
- A higher proportion of people with lower incomes take less leisure on weekends
- Those from lower income households are more likely to be working on weekends
- Annex: What is time use data and why are they important for the measurement of leisure time?
- References
1. Main points
- Across all parts of the UK, men spent more time on leisure activities than women (an average of six hours and nine minutes compared with five hours and 29 minutes per day respectively).
- The gender gap was greatest in the North West of England (men spent seven hours per week more than women on leisure time) and smallest in Northern Ireland (identical for both men women).
- People in South East England spent the most time on leisure activities (five hours and two minutes per day), compared with Northern Ireland, where they spent the least (four hours and 22 minutes per day).
- The majority of leisure time for both men and women was spent consuming mass media, for example, watching TV, reading or listening to music (16 hours and 24 minutes per week for men and 14 hours and 23 minutes for women).
- On average, men spent more time per week on sports, hobbies and computer games than women (four hours and 29 minutes and two hours and 29 minutes per week respectively), while women spent more time doing social activities (four hours and 19 minutes compared with three hours and two minutes per week for men).
- The age group spending the most time on leisure activities was those aged 65 and over (seven hours and 10 minutes per day), at 50% more time in leisure than the 25- to 34-year-olds, who took the least leisure time (four hours and 46 minutes per day).
- People who work in skilled trade professions spent the least time on leisure (four hours and 34 minutes per day), compared with people in sales and customer services professions who spent the most (five hours and 21 minutes per day).
- Those from high income households were more likely to be engaged in leisure activities on the weekends than those from low income households, who were more likely to be working.
- Of the individuals who were working, on average, those employed full-time spent the least amount of time performing leisure activities (four hours and 48 minutes per day), compared with those who were employed part-time (five hours and seven minutes per day); enjoyment of leisure was similar across all working groups.
- Of the individuals who were not working, those who were long-term sick spent the most time in leisure activities, at seven hours and 57 minutes per day, and were least likely to enjoy their leisure time; retired people took slightly less leisure time (seven hours and 19 minutes) and enjoyed their leisure time more.
2. Things you need to know about this release
Work-life balance is an aspect of a healthy life (see Haworth, 2005, page 170), and therefore it represents an important determining factor for the well-being of the UK population. However, except for the ONS Measuring National Well-being Programme, it is often the case that the highest profile official statistics are focused on measuring aspects of work as opposed to aspects of life.
To get a better understanding of how leisure time may affect well-being across the UK, Office for National Statistics (ONS) has analysed how much leisure time different groups in the UK take and assessed how this may fit in with other aspects of their life (such as paid work or unpaid work). The aim of this analysis is to give a more contextual understanding of leisure time and what it might mean to different people in the UK.
This analysis takes advantage of the latest UK Harmonised European Time Use Survey (UK HETUS; Gershuny and Sullivan, 2017) to measure the extent and distribution of leisure time in the UK in 2015.
To understand the analysis it is important to first note the definition of leisure used in this report.
Leisure in this report includes1:
- participatory activities
- socialising
- cultural activities
- resting and taking time out
- sports or outdoor pursuits
- hobbies, computing and games
- mass media
- eating out
- associated travel time with those leisure activities
Leisure in this report excludes:
- unpaid work2
- paid work or study
- activities necessary for existence such as sleeping or eating (apart from eating at restaurants, pubs or cafés)
- travel related to the previously listed activities
- activities that are not ineligible or unclassified
Controlling for socio-economic and demographic characteristics
Throughout this report the analysis relates only to those in the UK population who are aged 8 and over and covers the year 2015. When leisure is analysed across regions, occupations and groups of individuals based on their equivalised household income the data is further restricted to just those who are in some form of paid work only. The aim of this is to counter for differences in age demographics, and labour force characteristics which might influence the amount of leisure being reported. The robustness of the analysis has been tested using multiple regression modelling and the results of that testing reinforced the descriptive statistics contained within this report.
Notes for: Things you need to know about this release
Table 1 in the Annex shows more detail about the types of leisure activity that are included in the definition of leisure used in the article.
Unpaid work here is defined as anything households perform for themselves or other households as opposed to pay market services for. This may include childcare, adult care, volunteering, cooking, cleaning, DIY, gardening, transporting themselves or others, or ironing and washing clothes.
3. Men took more leisure than women in 2015 in the UK
When leisure time is considered for groups based on their sex, it is clear that men spend more time in leisure activities than women. In 2015, on average, men spent 6 hours and 9 minutes per day undertaking leisure pursuits as compared to 5 hours and 29 minutes spent by women (See figure 1).
Figure 1: Mean total daily leisure time by sex (whole population aged eight and over), UK, 2015
Source: Harmonised European Time Use Survey, 2015
Notes:
- Figures rounded to one decimal place.
Download this chart Figure 1: Mean total daily leisure time by sex (whole population aged eight and over), UK, 2015
Image .csv .xls4. When not in leisure, women were more likely to be performing unpaid work
Examining the difference in leisure time taken by men and women in 2015, leisure time can be situated among other types of activity during a 24-hour (1,440-minute) period. Figure 2 shows leisure time alongside paid work (or study time), unpaid work time and time spent performing other activities (such as sleep, personal care or unclassified activity).
Figure 2: Mean total daily leisure, unpaid work and paid work time by day of week and sex (whole population aged eight and over), UK, 2015
Source: Harmonised European Time Use Survey
Notes:
- Figures round to one decimal place.
Download this chart Figure 2: Mean total daily leisure, unpaid work and paid work time by day of week and sex (whole population aged eight and over), UK, 2015
Image .csv .xlsOur definition of unpaid work describes activities that members of households perform for their own, or other, households for free, but that could be contracted out to a market service provider. This may include activities such as childcare, adult care, volunteering or housework1. Where the “other” category includes sleep and personal care type activities it would be normal to expect around six to eight hours (360 to 480 minutes) of this time in a typical day.
When considering leisure time against “paid work (or study)” time, “unpaid work” time and time spent performing “other activities”, it is evident that, throughout the week, the combination of leisure time, paid work or study time and unpaid work time was similar for men and women. It was also clear that the difference in paid work or study time was not large enough to adequately explain the difference in leisure time between men and women. Therefore, the difference in unpaid work time was likely to be a factor too.
In 2015, for men, the days with the highest average time spent performing unpaid work were Mondays and Saturdays, where men carried out an average of 131 minutes of unpaid work per day. The day women spent the highest amount of time on unpaid work was Monday with an average of 207 minutes per day.
Notes for: When not in leisure, women were more likely to be performing unpaid work
- A more detailed breakdown of these categories is available in Annex A while a more complete measurement of the volume and value of time spent performing unpaid work can be found in the ONS Household Satellite Accounts (ONS, 2016).
5. Men spent more time playing sports, practising hobbies, gaming and computing or consuming mass media while women use more time for socialising
Figure 3 shows the average daily time spent by men and women in different types of leisure activity in 2015. Here, for both men and women, the general trend was the same, where men and women spent less time performing participation activities (26 minutes per week for men and 23 minutes per week for women) and the most time consuming mass media (16 hours 24 minutes per week for men and 14 hours and 23 minutes per week for women).
Figure 3: Mean leisure time per week by activity type and sex (whole population aged eight and over), UK, 2015
Source: Harmonised European Time Use Survey, 2015
Notes:
- Figures rounded to one decimal place.
Download this chart Figure 3: Mean leisure time per week by activity type and sex (whole population aged eight and over), UK, 2015
Image .csv .xlsHowever, there were some differences between the average amount of time spent per day by men and women in different forms of leisure. For example, not only did men spend more time consuming mass media (which includes activities such as watching TV, listening to music or reading) also men spent a higher average time per day undertaking hobbies, computing or playing games than women (4 hours 39 minutes to 2 hours 38 minutes per week respectively). On the other hand, women spent more social leisure time than men (4 hours and 19 minutes to 3 hours and 2 minutes per week respectively).
Back to table of contents6. Leisure time was lowest for those aged 25 to 34 years but increased with age
When the UK population was divided into age groups, the amount of leisure time was highest for the 16 to 24 age group, when considering age groups who are likely to not be retired. Those aged between 25 to 34 and 35 to 44 took the least leisure time of all the age groups at four hours and 46 minutes and four hours 53 minutes respectively, while the amount of leisure time taken gradually increased for those in higher age groups, with the amount of leisure time peaking for those aged 65 and over, who took an average of seven hours and 10 minutes leisure time per day.
Figure 4: Mean total daily leisure time by age (whole population aged eight and over), UK, 2015
Source: Harmonised European Time Use Survey, 2015
Notes:
- Figures rounded to one decimal place.
Download this chart Figure 4: Mean total daily leisure time by age (whole population aged eight and over), UK, 2015
Image .csv .xlsWhen considering how this varied between the sexes, men took more leisure time per day throughout the age bands; the gap was smallest for those aged 35 to 44 years, where men took an average of five hours and seven minutes of leisure per day compared with four hours and 40 minutes for women (Figure 5).
The youngest age group, the 16- to-24-year-olds, saw a larger difference between the sexes in the amount of leisure time taken as did those aged 45 and over. The 16-to-24-year-old men took an average of 59 minutes more leisure time than women, whereas those men who fell into the aged 45 to 54, 55 to 64 and 65 and over age groups took 51, 42 and 45 minutes respectively more leisure time per day than women.
Figure 5: Mean total daily leisure time by age and sex (whole population aged eight and over), UK, 2015
Source: Harmonised European Time Use Survey, 2015
Notes:
- Figures rounded to 1 decimal place.
Download this chart Figure 5: Mean total daily leisure time by age and sex (whole population aged eight and over), UK, 2015
Image .csv .xlsMen in the 16-to-24-year-old age group took an average of six hours 27 minutes of leisure time per day while women of that age took an average of five hours and 28 minutes per day. Men in the aged 45 to 54, 55 to 64 and 65 and over age groups took an average of five hours and 45 minutes, six hours and 19 minutes and seven hours and 35 minutes of leisure per day respectively; while women in the aged 45 to 54, 55 to 64 and 65 and over age groups took four hours and 54 minutes, five hours and 37 minutes and six hours and 50 minutes of leisure time per day respectively.
Figure 6: Mean total daily leisure, unpaid and paid work time by age and sex (whole population aged eight and over), UK, 2015
Source: Harmonised European Time Use Survey, 2015
Notes:
- Figures rounded to one decimal place.
Download this chart Figure 6: Mean total daily leisure, unpaid and paid work time by age and sex (whole population aged eight and over), UK, 2015
Image .csv .xlsAs with leisure by sex and day of the week, leisure time taken by sex and age group can be situated among other categories of time such as time performing unpaid work (for example, informal care, housework), paid work or study, or other time (such as sleep or personal care).
As can be seen in Figure 6, the story changes slightly across the age groups where the average paid working or study time in the youngest 16-to-24-year-old age group was similar for both men and women, at which point women’s additional time carrying out unpaid work offsets some of their leisure time. When looking at the following two age groups (25 to 34 and 35 to 44), it seemed that women’s leisure time was offset by unpaid work to an increasing degree but for men, their leisure time seemed to be offset, but by paid work or study rather than unpaid work.
Women in the 25 to 34 and 35 to 44 age groups carried out the most unpaid work, working 250 and 273 minutes per day respectively, but they also took the least leisure time, taking 271 and 280 minutes of leisure per day respectively. This meant that women aged 25 to 34 years spent 91% longer than men of a similar age performing unpaid work but took 10% less leisure time, and women aged 35 to 44 years spent 65% longer than men of a similar age performing unpaid work and took 9% less leisure time.
Back to table of contents7. Leisure time was highest for those in the South East of England and lowest for those in Northern Ireland
To control for the effects of varying levels of unemployment across different regions, this section focuses on only those in employment. Based on this sample, the data in Figure 7 suggests that those who lived in Northern Ireland or the north of England took the least leisure time at four hours and 22 minutes, and four hours and 33 minutes per day respectively. Those who lived in Wales and the South East of England took the most leisure time at five hours and two minutes per day for both regions.
Figure 7: Mean total daily leisure time by region of residence (those in employment), UK, 2015
Source: Harmonised European Time Use Survey, 2015
Notes:
- Figures rounded to one decimal place.
Download this chart Figure 7: Mean total daily leisure time by region of residence (those in employment), UK, 2015
Image .csv .xlsTaking the analysis a step further, it was also evident that in some of the areas where the least leisure time was taken (such as the north of England), there was also the largest difference in leisure time taken between the sexes (see Figure 8). For example, employed men in the North West took an average of 7.0 hours of leisure time per week more than women. However, Northern Ireland was the exception, having lower amounts of leisure time taken per week but there was almost no difference between the sexes, where men took 30 hours and 37 minutes and women took 30 hours and 35 minutes of leisure time per week.
Figure 8: Difference in leisure time between men and women by region (those in employment), UK, 2015
Source: Harmonised European Time Use Survey, 2015
Notes:
- Figures rounded to one decimal place.
Download this chart Figure 8: Difference in leisure time between men and women by region (those in employment), UK, 2015
Image .csv .xls8. Those in skilled trades took the least leisure time while those in sales and customer service occupations took the most
When splitting the sample by occupation, the group who took the highest average leisure time were those who worked in sales and customer services, at five hours and 21 minutes per day. Those in skilled trades took the least leisure time, at four hours and 34 minutes per day.
Figure 9: Mean total daily leisure time by occupation, UK, 2015
Source: Harmonised European Time Use Survey, 2015
Notes:
- Figures rounded to one decimal place.
Download this chart Figure 9: Mean total daily leisure time by occupation, UK, 2015
Image .csv .xlsBy breaking this analysis down further to compare the sexes, it was still evident that a gap in average leisure time taken exists. Although men and women in skilled trades took the least amount of leisure time, they were the most equal out of the occupation groups at four hours and 33 minutes per day for men and four hours and 39 minutes for women. Conversely, those in sales and customer service occupations took the highest amount of leisure time per day but also had the largest difference between the sexes, with men taking six hours and three minutes per day and women taking four hours and 53 minutes per day (see Figure 10).
Figure 10: Mean total daily leisure time by occupation and sex, UK, 2015
Source: Harmonised European Time Use Survey, 2015
Notes:
- Figures rounded to one decimal place.
Download this chart Figure 10: Mean total daily leisure time by occupation and sex, UK, 2015
Image .csv .xls9. Those employed full-time took the least leisure time but enjoyed it most
This section of the report considers how the amount of leisure time changes with work status. Figure 11 shows that the amount of leisure time taken is lowest for those who are in full-time employment, at four hours and 48 minutes of leisure per day, and highest for those who are retired or not working as they have a long-term illness, at seven hours and 19 minutes and seven hours and 57 minutes of leisure per day respectively.
Figure 11: Mean total daily leisure time by work status, UK, 2015
Source: Harmonised European Time Use Survey, 2015
Notes:
- Figures rounded to one decimal place.
Download this chart Figure 11: Mean total daily leisure time by work status, UK, 2015
Image .csv .xlsWhen the men and women who are included in these work status groups are considered, the same pattern of men taking more leisure time on average than women is evident. However, the trend is more pronounced in some work status groups than in others (see Figure 12).
For example, for those in full-time employment or those who were self-employed, there was little difference in the amount of leisure time taken by men and women, where full-time employed men took an average of five hours and two minutes of leisure per day while women took four hours and 27 minutes per day. Men in self-employment also took four hours and 59 minutes of leisure per day but women took a more equal amount of four hours and 53 minutes per day. Conversely, men and women who were at home looking after the family saw the largest difference in average leisure time taken, where men took seven hours and six minutes and women took five hours and 18 minutes per day.
Figure 12: Mean total daily leisure time by work status and sex, UK, 2015
Source: Harmonised European Time Use Survey, 2015
Notes:
- Figures rounded to one decimal place.
Download this chart Figure 12: Mean total daily leisure time by work status and sex, UK, 2015
Image .csv .xlsAnother interesting feature shown in Figure 12 is that women working part-time took just 8% more leisure time than those women working full-time, while men who worked part-time took 22% more leisure time than men working full-time. Taking into account the data shown in Figure 2 and Figure 6 it is likely that women who work part-time used their time outside of paid work to perform unpaid work rather than leisure. Office for National Statistics (ONS) analysis has previously shown that a much higher proportion of women with dependent children work part-time whereas a lower proportion of men with dependent children do the same and therefore it maybe that women who worked part-time performed childcare-related activities as opposed to leisure pursuits.
Figure 13: Mean enjoyment of leisure or non-leisure time by work status, UK, 2015
Source: Harmonised European Time Use Survey, 2015
Notes:
- Figures rounded to one decimal place.
Download this chart Figure 13: Mean enjoyment of leisure or non-leisure time by work status, UK, 2015
Image .csv .xlsFigure 13 shows the average enjoyment of leisure time relative to non-leisure time (for example, how much someone enjoyed time spent playing football relative to time spent at work). This suggests that those who belonged to a work status taking the least leisure time were also those who enjoyed leisure time the most compared with the rest of their day. For example, among those who enjoyed leisure time the most were those in full-time employment. Of those who were not employed, the group that enjoyed leisure time the least relative to the rest of their day were those who were long-term sick.
These data support the idea that the enjoyment of leisure is something which diminishes after a certain duration of time. Gershuny (2011) shows that enjoyment of leisure tends to increase, peak and then diminish the longer the episode of leisure. The rate at which this happens is also largely dependent on the activity, for example, watching TV tends to become less enjoyable more quickly than outdoor leisure pursuits.
Back to table of contents10. A higher proportion of people with lower incomes take less leisure on weekends
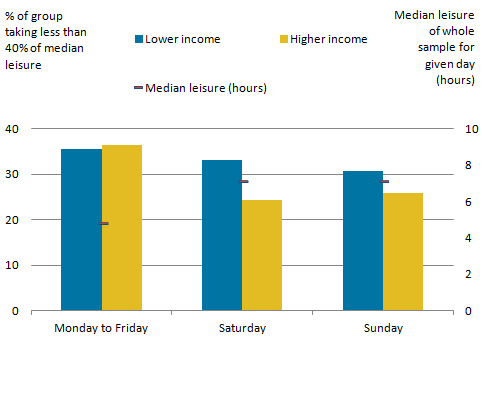
Based on their median household income, there is not that great a difference in people’s leisure time taken at weekends; however, by looking at just those who take a very short amount of leisure time (less than 40% of median) it shows that a higher proportion of those from lower income households take less leisure time on weekends (see Figure 15).
Figure 14 shows that the largest difference between those from higher and lower income households was on Saturdays where 33.1% of those from lower income households took less than 40% of the median leisure time, as opposed to 24.3% of those from higher income households. The median leisure time taken on Saturdays was 7 hours and 12 minutes.
Figure 14: Proportion of groups based on their equivalised household income who take less than 40% of the median leisure time on any given day of the week (includes only those in work however the median is based on the whole population) UK, 2015
Source: Harmonised European Time Use Survey, 2015
Notes:
- Figures rounded to one decimal place.
Download this image Figure 14: Proportion of groups based on their equivalised household income who take less than 40% of the median leisure time on any given day of the week (includes only those in work however the median is based on the whole population) UK, 2015
.png (10.6 kB) .xls (25.6 kB)
11. Those from lower income households are more likely to be working on weekends
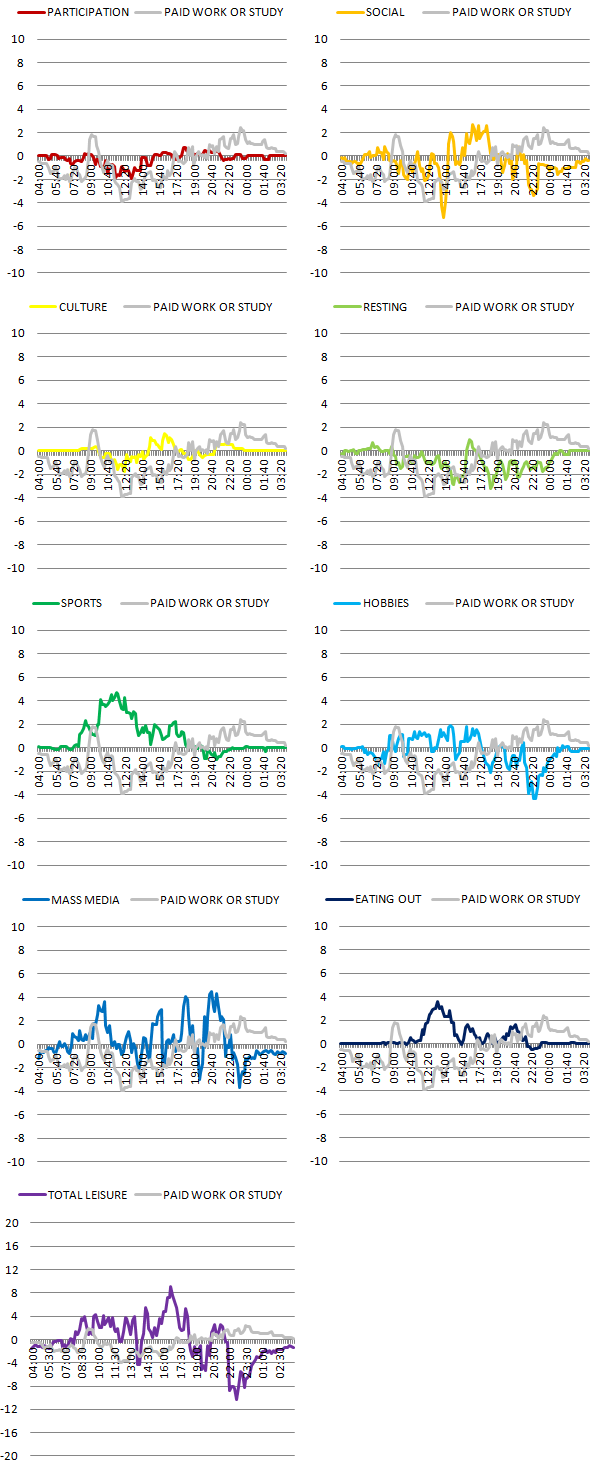
This section helps to draw out the differences between how those from high or low income households spend their time on Saturdays or Sundays. The activity participation rate of those from low income households (that is, “X%” of those from low income households were engaged in “Y” activity) is subtracted from the activity participation rate of those from high income households. This is done in such a way that any activity that appears in the top half of Figure 15 is carried out more frequently by those in high income households than low income households at that given point of time. Similarly, if the activity appears in the lower half of the chart then it is performed more frequently by low income households.
Different leisure activities are shown alongside paid work or study to demonstrate how leisure time fits with unsocial working hours (that is, weekend work) for different groups based on their equivalised1 household income.
Figure 15: Difference in the proportion of those in either leisure time or paid work or study on Saturdays, based on their equivalised household income, UK, 2015
Source: Harmonised European Time Use Survey, 2015
Notes:
- Figures rounded to 1 decimal place.
Download this image Figure 15: Difference in the proportion of those in either leisure time or paid work or study on Saturdays, based on their equivalised household income, UK, 2015
.png (83.1 kB) .xls (60.4 kB)
Evidence in Figure 14 suggests that there was a subgroup of those from lower income households who took less leisure time on weekends than those from higher income households. To explore this idea in more detail, this analysis compares the proportion of each group who are engaged in any given leisure activity or paid work or study at any time of day, with the rationale that performing paid work on weekends may affect the amount of leisure taken and when that leisure is taken. The proportion of those from low income households is then subtracted from the proportion of those engaged in a particular activity, at that time, from high income households.
Figure 15 shows that in 2015 a higher proportion of those from higher income households were socialising, taking part in cultural activities, playing sports or consuming mass media on a typical Saturday, while a higher proportion of those from lower income households were either at work or studying.
Figure 16: Difference in the proportion of those in either leisure time or paid work or study on Sundays, based on their equivalised household income, UK, 2015

Source: Harmonised European Time Use Survey, 2015
Notes:
- Figures rounded to 1 decimal place.
Download this image Figure 16: Difference in the proportion of those in either leisure time or paid work or study on Sundays, based on their equivalised household income, UK, 2015
.png (229.8 kB) .xls (60.4 kB)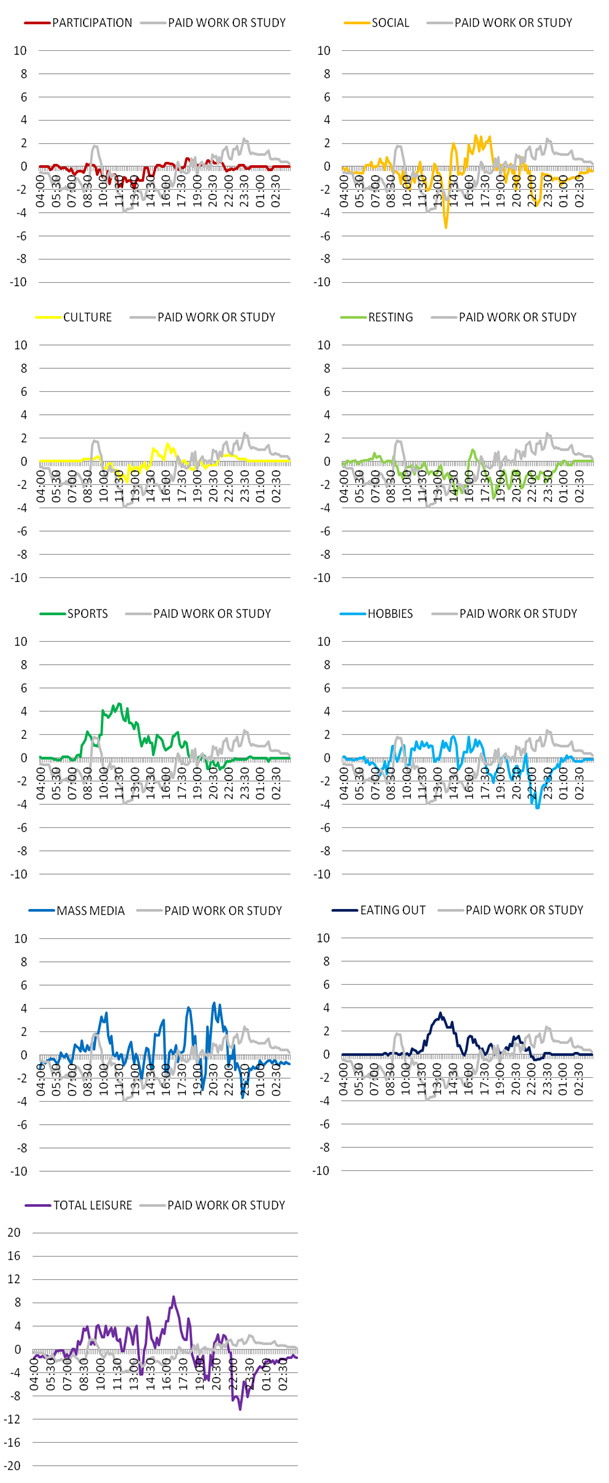
Figure 16 shows that on Sundays in 2015, a higher proportion of those from lower income households were engaged in participatory activities (such as going to church) while more of those from higher income households tended to be engaged in sport, hobbies or were consuming mass media.
Notes for: Those from lower income households are more likely to be working on weekends
- Equivalised household income is where income is controlled for the number of individuals who are reliant on it. Income is adjusted here using the Organisation for Economic Co-operation and Development (OECD) modified scale, first proposed by Hagenaars et al. (1994).
12. Annex: What is time use data and why are they important for the measurement of leisure time?
Time use data are normally collected by household survey and records how people use their time. Different types of time use survey may have different purposes but generally, they aim to capture a nuanced picture of the use time. Activities captured within time use data are sometimes even “open coded” allowing people to describe how they used their time in their own words, which are then coded into an activity coding frame by researchers within the data collection agency or organisation.
Due to its costly nature, and because there is no legislative requirement for countries to produce time use data by law, there can be long periods between time use surveys and this has been the case in the UK where, until recently, the last UK Harmonised European Time Use Survey (HETUS) was released in 2002 with data collected for the reference period spanning from 2000 to 2001.
In January 2017 a new UK HETUS was published by the Centre for Time Use Research (Gershuny and Sullivan, 2017) for the reference period spanning 2014 to 2015. The availability of this new data now gives social researchers, statisticians and economists the opportunity to provide useful in-depth analysis on a vast range of topics. Furthermore, the method in which the data are collected ensures that there is minimal recall error and, as such, the data can be used to validate or even disprove existing assumptions about life in the UK.
Table 1: Leisure activities included in the definition of leisure in this report
| Category of leisure | Examples of type of activity (list not exhaustive) | |
|---|---|---|
| Participatory activities | · Religious activities such as going to church | · Participating in meetings for organisations such as scouts or other groups (when not in a position of trust) |
| Socialising | · Socialising with family | · Going clubbing or going to the pub |
| · Visiting and receiving visitors | · Being out with friends | |
| · Celebrations | · Talking in a cafe | |
| · Telephone conversations | ||
| Cultural activities | · Cinema | · Library |
| · Concerts or other live music | · Sports events | |
| · Plays, musicals or pantomimes | · Visit a historical site | |
| · Opera | · Visit a wildlife or botanical site | |
| · Dance performances | · Visiting an urban park, playground, designated play area | |
| · Art exhibitions and museums | · Visit a leisure park | |
| Resting and taking time out | · Doing nothing, just sitting, reflecting, relaxing, resting, waiting, meditating, smoking, sun bathing, thinking, talking to /scratching a cat or dog etc | |
| Sports or outdoor pursuits | · Ball games such as football, rugby, volleyball, basket ball, tennis, badminton etc. | · Skiing or Skating |
| · Walking or hiking | · Cycling or rowing | |
| · Running or Jogging | · Gymnastics | |
| · Hunting and fishing | · Cycling or rowing | |
| · Swimming or other watersports | ||
| · Other productive exercise | ||
| Hobbies/computing/games | · Painting, Singing, Film making or Playing a musical instrument | · Programming, fixing or repairing a computer |
| · Collecting (stamps, coins for example) | · Surfing the net | |
| · Writing letters/Christmas cards | · Communication over the internet (skype for pleasure) | |
| · Conducting experiments | · Gambling | |
| · Writing novels, poetry or a personal diary | · Board games | |
| · Computer games | ||
| · Played darts | ||
| · Played pin-ball | ||
| · Built a jigsaw | ||
| Mass media | · Watching TV or DVDs | · Reading brochures, advertisements and catalogues |
| · Listening to radio | · Listening to pre-recorded music | |
| · Reading for pleasure | ||
| Eating out | · Eating in a restaurant, café or pub | |
| Associated travel time with those leisure activities | · All travel time recorded as related to the above mentioned activities | |
| Source: Office for National Statistics | ||
Download this table Table 1: Leisure activities included in the definition of leisure in this report
.xls (24.1 kB)13. References
Gershuny, J. (2011). Time-Use Surveys and the Measurement of National Well-Being, Centre for Time-use Research, Department of Sociology, University of Oxford.
Gershuny, J., Sullivan, O. (2017). United Kingdom Time Use Survey, 2014-2015. [data collection]. UK Data Service. SN: 8128.
Haworth, J. (2005). Work, Leisure and Well-Being. New York and London, Routledge.
ONS (2016) Household satellite accounts: 2005 to 2014. Office for National Statistics, Newport.
ONS (2017) Families and the Labour Market, England: 2017 Office for National Statistics, Newport.
Back to table of contents