1. Main findings
In 2012, 1.5 per cent of adults in the UK identified themselves as Gay, Lesbian or Bisexual
Adults aged 16 to 24 were more likely to identify themselves as Gay, Lesbian or Bisexual (2.6 per cent) compared with adults aged 65 and over (0.4 per cent)
Across the UK, 77 per cent of men and 75 per cent of women reported that they were ‘in good health’
Fewer than one in ten adults aged 16 to 24 (9.3 per cent) considered themselves as not being in good health. This compared with more than four in ten (43 per cent) of those aged 65 and over
One in five adults (aged 18+) were current smokers in the UK in 2012. Regions in the North of England and Scotland had the highest proportions of current smokers in the UK. London and the South East had some of the lowest proportions of current smokers
2. Introduction
This bulletin provides information from the January to December 2012 Integrated Household Survey (IHS).
The IHS is the largest social survey collected by the Office for National Statistics (ONS), providing estimates from approximately 340,000 individual respondents - the biggest pool of UK social data after the census.
This large sample size is achieved by asking a core suite of questions on two ONS household surveys, the Annual Population Survey (APS) and Living Cost and Food Survey (LCF). Topics covered by the IHS include sexual identity, perceived general health, smoking prevalence, education, housing and employment. More detailed information on the survey, and how to carry out your own analysis, can be found in the background notes.
At present, IHS statistics are designated as experimental. Information on what this means can be found in the background notes.
This is the first release from the IHS on a calendar year basis (January to December 2012). Previous IHS Statistical Bulletins have reported on a financial year basis (April 2011 to March 2012). This follows from an ONS consultation held in August 2012, which approved the proposed reduction of IHS annual datasets from 4 to 1 releases per year.
This release provides estimates from data collected between January to December 2012. Readers interested in previous IHS releases can find these on the ONS website.
Back to table of contents3. Sexual identity
In 2012, the Integrated Houshold Survey found:
1.1 per cent of adults identified themselves as Gay or Lesbian (approximately 545,000 adults)
0.4 per cent of adults identified themselves as Bisexual (approximately 220,000 adults)
These estimates are similar to those found in the April 2011-March 2012 IHS bulletin.
Sexual identity by gender
Men were more likely than women to consider themselves as Gay or Lesbian:
1.5 per cent of adult males identified themselves as Gay compared to 0.7 per cent of adult females who identified themselves as Lesbian or Gay
0.3 per cent of adult males identified themselves as Bisexual compared to 0.5 per cent of adult females
Table 1 summarises the distribution between sexual identity and gender in 2012.
Table 1: Sexual identity by gender, January to December 2012
| % | |||
| Gender | 2012 | ||
| Men | Women | Total | |
| Heterosexual / Straight | 93.2 | 93.7 | 93.5 |
| Gay / Lesbian | 1.5 | 0.7 | 1.1 |
| Bisexual | 0.3 | 0.5 | 0.4 |
| Other | 0.3 | 0.3 | 0.3 |
| Don't know / Refusal | 3.5 | 3.8 | 3.6 |
| No response2 | 1.2 | 1.0 | 1.1 |
| Source: Integrated Household Survey - Office for National Statistics | |||
| Notes: | |||
| 1. In 2012 there were 178,197 eligible respondents (aged 16 and over) to the sexual identity question. Of these 169,239 provided a valid response. The question was not asked by proxy. | |||
| 2. ONS defines 'no response' as no data provided to the question by an eligible responder. | |||
| 3. The 'no response' category includes respondents who were aged 15 in wave 1 of the LFS/APS but are now aged 16 in the January to December 2012 field period. Information on a change affecting the processing of these can be found in the background notes. | |||
| 4. Percentages might not add to 100 per cent due to rounding. | |||
| 5. Confidence intervals for the latest estimates in the above table can be found in the excel download table. Information on what confidence intervals are can be found in the background notes. | |||
Download this table Table 1: Sexual identity by gender, January to December 2012
.xls (33.8 kB)Sexual identity by region
London had the highest proportion of adults who said they were Gay, Lesbian or Bisexual (2.5 per cent). However the proportions of adults identifying themselves as Gay, Lesbian or Bisexual within the other regions were largely similar in 2012, ranging from 1.0 per cent in the East of England to 1.7 per cent in the North East.
Figure 1: Sexual Identity: Percentage of Gay, Lesbian and Bisexual Adults by Region, January to December 2012
Source: Office for National Statistics
Notes:
- In 2012 there were 178,197 eligible respondents (aged 16 and over) to the sexual identity question. Of these 169,239 provided a valid response. The question was not asked by proxy.
- ONS defines 'no response' as no data provided to the question by an eligible responder.
- The 'no response' category includes respondents who were aged 15 in wave 1 of the LFS/APS but are now aged 16 in the January to December 2012 field period. Information on a change affecting the processing of these cases can be found in the background notes.
- Percentages might not add to 100 per cent due to rounding.
- The whisker bar represents the confidence intervals for each estimate. Information on what confidence intervals are can be found in the background notes.
Download this chart Figure 1: Sexual Identity: Percentage of Gay, Lesbian and Bisexual Adults by Region, January to December 2012
Image .csv .xlsSexual identity by age group
The proportion of adults identifying themselves as Gay, Lesbian or Bisexual in 2012 reduced through the age groups.
Around 2.6 per cent of adults aged 16 to 24 identified themselves as Gay, Lesbian or Bisexual. This compared with 0.4 per cent of those aged 65 and over (Table 2)1.
Table 2: Sexual identity by age group, January to December, 2012
| % | |||||
| Age groups | 16-24 | 25-34 | 35-49 | 50-64 | 65+ |
| Heterosexual / Straight | 91.2 | 92.7 | 93.0 | 94.8 | 95.0 |
| Gay / Lesbian | 1.7 | 1.5 | 1.5 | 0.7 | 0.3 |
| Bisexual | 1.0 | 0.6 | 0.4 | 0.3 | 0.2 |
| Other | 0.2 | 0.2 | 0.3 | 0.3 | 0.3 |
| Don't know / Refusal | 3.8 | 3.8 | 3.7 | 3.0 | 4.0 |
| No response2 | 2.1 | 1.3 | 1.2 | 0.8 | 0.3 |
| Source: Integrated Household Survey - Office for National Statistics | |||||
| Notes : | |||||
| 1. In 2012 there were 178,197 eligible respondents (aged 16 and over) to the sexual identity question. Of these 169,239 provided a valid response. The question was not asked by proxy. | |||||
| 2. ONS defines 'no response' as no data provided to the question by an eligible responder. | |||||
| 3. The 'no response' category includes respondents who were aged 15 in wave 1 of the LFS/APS but are now aged 16 in the January to December 2012 field period. Information on a change affecting the processing of these cases can be found in the background notes. | |||||
| 4. Percentages might not add to 100 per cent due to rounding. | |||||
| 5. Confidence intervals for the latest estimates in the above table can be found in the excel download table. Information on what confidence intervals are can be found in the background notes. | |||||
Download this table Table 2: Sexual identity by age group, January to December, 2012
.xls (33.8 kB)Notes for sexual identity
- The percentages in this paragraph are based on un-rounded estimates. Therefore these percentages may differ from those calculated from the rounded estimates available in table 2.
4. Perceived general health
Across the UK more than three quarters (76 per cent) of the adult population stated that they were ‘in good general health’ in 2012.
Previous estimates of perceived general health can be found in the April 2011-March 2012 IHS bulletin.
Perceived general health by region
Regional differences could be identified in UK adults’ perception of their general health (Figure 2):
of the constituent countries of the UK, Wales reported the lowest rate of perceived good health in 2012 (73 per cent)
at the regional level the North East of England reported the lowest rate of perceived good health (71 per cent); London and the South East reported the highest rate of perceived good heath (79 per cent)
Figure 2: Health by Region, January to December 2012
Source: Office for National Statistics
Notes:
- The total number of eligible responders to the question was 272,439. The question was asked to respondents aged 16 and over.
- The health categories were dichotomised using the approach applied by Eurostat. The category 'In good health' comprises the 'very good' and 'good' perceived health categories; the category 'Not in good health' comprises the categories 'fair', 'bad' and 'very bad'.
- Percentages may not add to 100 per cent due to rounding.
- Confidence intervals for the latest estimates in the above chart can be found in the excel download table. Information on what confidence intervals are can be found in the background notes.
Download this chart Figure 2: Health by Region, January to December 2012
Image .csv .xlsPerceived general health by age and gender
A higher proportion of men reported themselves to be ‘in good health’ compared to women. This difference was most noticeable for the 16-24 age group where 91.9 percent of males reported themselves to be in good health compared to 89.5 per cent of females.
The proportion of adults reporting themselves ‘not in good health’ increased with age:
Fewer than one in ten (9.3 per cent) of those aged 16 to 24 reported themselves as ‘not in good health’
More than four in ten (43 per cent) of those aged 65 and over reported themselves as ‘not in good health’ (Table 3)
Table 3: Health by age group by gender, January 2012 to December 2012
| % | ||||||
| Age group | In good health | Not in good health | ||||
| Male | Female | Total | Male | Female | Total | |
| 16-24 | 91.9 | 89.5 | 90.7 | 8.1 | 10.5 | 9.3 |
| 25-34 | 88.5 | 87.7 | 88.1 | 11.5 | 12.3 | 11.9 |
| 35-49 | 82.1 | 79.9 | 81.0 | 17.9 | 20.1 | 19.0 |
| 50-64 | 70.1 | 69.6 | 69.8 | 29.9 | 30.4 | 30.2 |
| 65+ | 57.5 | 56.2 | 56.8 | 42.5 | 43.8 | 43.2 |
| Total | 77.3 | 75.0 | 76.1 | 22.7 | 25.0 | 23.9 |
| Source: Integrated Household Survey - Office for National Statistics | ||||||
| Notes: | ||||||
| 1. The total number of eligible responders to the question was 272,439. The question was asked to respondents aged 16 and over. | ||||||
| 2. The health categories were dichotomised using the approach applied by Eurostat. The category 'In good health' comprises the 'very good' and 'good' perceived health categories; the category 'Not in good health' comprises the categories 'fair', 'bad' and 'very bad'. | ||||||
| 3. Percentages may not add to 100 per cent due to rounding. | ||||||
| 4. Confidence intervals for the latest estimates in the above table can be found in the excel download table. Information on what confidence intervals are can be found in the background notes. | ||||||
Download this table Table 3: Health by age group by gender, January 2012 to December 2012
.xls (34.3 kB)Perceived general health by occupation
Adults in ‘Routine and manual’ occupations were more likely to consider themselves ‘not in good health’ when compared with adults in ‘Intermediate’, and ‘Managerial and professional’ occupations (Figure 3).
Figure 3: Poor Health by Occupation, January to December 2012
Source: Office for National Statistics
Notes:
- The total number of eligible responders to the question was 272,439. The question was asked to respondents aged 16 and over.
- The health categories were dichotomised using the approach applied by Eurostat. The category 'In good health' comprises the 'very good' and 'good' perceived health categories; the category 'Not in good health' comprises the categories 'fair', 'bad' and 'very bad'.
- Confidence intervals for the latest estimates in the above chart can be found in the excel download table.
- The whisker bar represents the confidence intervals for each estimate. Information on what confidence intervals are can be found in the background notes.
Download this chart Figure 3: Poor Health by Occupation, January to December 2012
Image .csv .xls5. Smoking prevalence
Within the UK, one in five adults (19.8 per cent) were current smokers in 2012. One third of adults (32.7 per cent) were ex-smokers, with nearly half (47.5 per cent) of adults stating they had never smoked.
Previous estimates of smoking prevalence can be found in the April 2011-March 2012 IHS bulletin. ONS has also published a short story on Smoking Habits Amongst Adults, based on data from the 2012 Opinions and Lifestyle Survey.
Smoking prevalence by gender
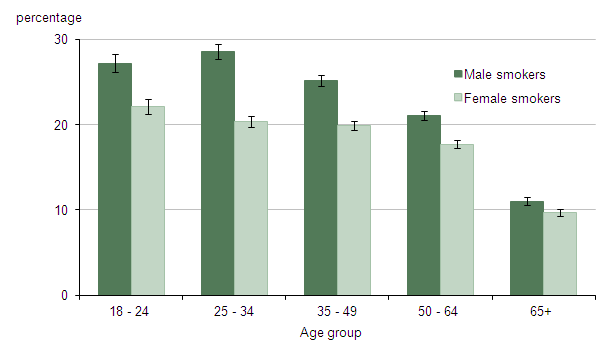
Figure 4 shows that males were more likely to be current smokers across every age group, when compared to females.
Figure 4: Current Smoking Prevalence by Age and Gender, January to December 2012
Source: Office for National Statistics
Notes:
- The total number of eligible responders to the question was 264,416. The question was asked to respondents aged 18 and over.
- Confidence intervals for the latest estimates in the above table can be found in the excel download table.
- The whisker bar represents the confidence intervals for each estimate. Information on what confidence intervals are can be found in the background notes.
Download this image Figure 4: Current Smoking Prevalence by Age and Gender, January to December 2012
.png (11.7 kB) .xls (38.4 kB)
Smoking prevalence by region
Differences in rates of smoking prevalence were found by geographic region (Table 4):
of the constituent countries of the UK, Scotland reported the highest proportion of current smokers in 2012 (22.2 per cent)
at the regional level London and the South East reported some of the lowest proportion of current smokers (18.0 per cent). Yorkshire and the Humber reported the highest proportion of current smokers (22.7 per cent)
Table 4: Smoking prevalence by region, January to December
| % | ||||
| Current smoker | Ex- smoker | Never smoked | ||
| England | 19.5 | 33.2 | 47.3 | |
| North East | 22.1 | 33.1 | 44.8 | |
| North West | 21.6 | 32.1 | 46.4 | |
| Yorkshire and The Humber | 22.7 | 32.5 | 44.8 | |
| East Midlands | 19.9 | 32.6 | 47.6 | |
| West Midlands | 18.9 | 30.3 | 50.8 | |
| East of England | 18.7 | 34.8 | 46.5 | |
| London | 18.0 | 28.7 | 53.3 | |
| South East | 18.0 | 36.4 | 45.6 | |
| South West | 18.5 | 38.2 | 43.3 | |
| Wales | 20.7 | 32.4 | 46.9 | |
| Scotland | 22.2 | 31.8 | 46.0 | |
| Northern Ireland | 18.6 | 21.3 | 60.1 | |
| UK | 19.8 | 32.7 | 47.5 | |
| Source: Integrated Household Survey - Office for National Statistics | ||||
| Notes: | ||||
| 1. The total number of eligible responders to the question was 264,416. The question was asked to respondents aged 18 and over. | ||||
| 2. Percentages may not add to 100 per cent due to rounding. | ||||
| 3. Confidence intervals for the latest estimates in the above table can be found in the excel download table. Information on what confidence intervals are can be found in the background notes. | ||||
Download this table Table 4: Smoking prevalence by region, January to December
.xls (33.8 kB)Smoking prevalence by occupation
Smoking prevalence rates also appeared to differ by occupation. Around 30 per cent of adults in ‘Routine and manual’ occupations were current smokers. This compared to 14 per cent of adults in ‘Managerial and professional’ occupations (Figure 5).
Figure 5: Current Smoking Prevalence by Occupation, January to December 2012
Source: Office for National Statistics
Notes:
- The total number of eligible responders to the question was 264,416. The question was asked to respondents aged 18 and over.
- Confidence intervals for the latest estimates in the above table can be found in the excel download table.
- The whisker bar represents the confidence intervals for each estimate. Information on what confidence intervals are can be found in the background notes.
Download this chart Figure 5: Current Smoking Prevalence by Occupation, January to December 2012
Image .csv .xls6. Perceived general health and smoking prevalence
When comparing smoking prevalence and general health, current smokers were less likely to report themselves to be in good health compared to those who have never smoked (Table 5).
The age of adults also appeared to have an impact on the perceived general health of current smokers and non-smokers.
When looking at adults aged 18-24 years old, 85.1 per cent of current smokers considered themselves to be in good health. This compared with 91.9 per cent who had never smoked, a difference of 6.8 per cent.
For adults aged 50-64 years old, the difference in the perceived general health between current smokers and adults who had never smoked was larger. 56.7 per cent of current smokers considered themselves in good health. This compared with 75.5 per cent of adults who had never smoked, a difference of 18.8 per cent.
This suggests smoking can have a bigger perceived effect on general health as age increases.
Table 5: Smoking prevalence by age group by health, January 2012 to December 2012
| % | ||||
| Age group | In good health | Not in good health | ||
| Current smoker | Never smoked | Current smoker | Never smoked | |
| 18-24 | 85.1 | 91.9 | 14.9 | 8.1 |
| 25-34 | 81.8 | 90.6 | 18.2 | 9.4 |
| 35-49 | 70.3 | 84.7 | 29.7 | 15.3 |
| 50-64 | 56.7 | 75.5 | 43.3 | 24.5 |
| 65+ | 48.1 | 59.9 | 51.9 | 40.1 |
| Source: Integrated Household Survey - Office for National Statistics | ||||
| Notes: | ||||
| 1. The total number of eligible responders to the question was 264,416. The question was asked to respondents aged 18 and over. | ||||
| 2. The health categories were dichotomised using the approach applied by Eurostat. The category 'In good health' comprises the 'very good' and 'good' perceived health categories; the category 'Not in good health' comprises the categories 'fair', 'bad' and 'very bad'. | ||||
| 3. Percentages may not add to 100 per cent due to rounding. | ||||
| 4. Confidence intervals for the latest estimates in the above table can be found in the excel download table. Information on what confidence intervals are can be found in the background notes. | ||||